To measure AI fluency across an organization, combine two kinds of data: what people know about AI (from assessments, training records or surveys) and how they actually use it at work (from the usage data your AI tools already record). Then report it by team and role, never by individual, and track how it changes over time and after training.
Being AI-fluent means understanding AI, using it productively, and applying it to real problems at work. Knowing how fluent your workforce is shows you where AI is paying off and where people need help. This guide explains why to measure AI fluency, how fluency differs from literacy, a simple rubric you can use, how to measure by team and role and after training, and which courses help build fluency.
Tracking your organization’s AI fluency isn’t just a vanity exercise. It’s essential for continuous improvement and strategic alignment. Leaders increasingly recognize that simply rolling out AI tools isn’t enough; you must monitor how widely and effectively those tools are used to ensure they deliver real value. In fact, the old adage “you can’t improve what you don’t measure” rings especially true for AI adoption. Here are key reasons why measuring AI fluency is so important:
In summary, measuring AI fluency in your organization ensures that AI adoption isn’t happening in the dark. It makes success measurable and challenges visible. With solid metrics, you can celebrate wins (backed by numbers), address weaknesses with concrete action, and continually refine how your people and AI work together.
AI literacy is what people know: what AI can and can't do, how to prompt it, and how to use it responsibly. AI fluency is what people do: whether AI is part of their everyday work and how many kinds of tasks they use it for. You need both, but they are measured differently.
| AI literacy | AI fluency | |
|---|---|---|
| What it means | Knowledge and understanding of AI | Regular, productive use of AI in real work |
| How to measure it | Assessments, quizzes, course completion, self-reported surveys | Usage data from AI tools: how often, how widely, for which tasks |
| Strength | Shows understanding and confidence | Objective, continuous, covers everyone with a license |
| Weakness | Self-reports drift from reality, and a course passed doesn't mean daily use | Shows behavior, not why people do or don't use AI |
Most companies start with literacy because it is easy to survey. In the EU, the AI Act also asks providers and deployers of AI systems to take measures for a sufficient level of AI literacy among their staff, with that rule applying from February 2, 2025. But literacy alone can't tell you whether training changed how people work. For that you need behavioral usage data, which you can collect without surveys from the admin and analytics APIs of tools like Microsoft Copilot, ChatGPT Enterprise, Claude and Gemini. For more on the knowledge side, see our guide to AI literacy in the workforce.
A rubric turns usage data into levels that leaders can follow. The thresholds below are examples only. Adjust them to your tools, roles and goals.
| Level | Example threshold (last 28 days) | What it looks like |
|---|---|---|
| 0. Not started | No AI use | Has access but hasn't used it |
| 1. Exploring | AI used on 1 to 3 days | Occasional tries, one tool, one kind of task |
| 2. Regular | AI used on 4 to 11 days | Weekly habit, usually for one or two tasks such as drafting or summarizing |
| 3. Fluent | AI used on 12 or more days, for 2 or more kinds of task | AI on most workdays, across several tasks |
| 4. Advanced | Fluent, plus AI in more than one kind of tool (for example a chat assistant and AI built into email, documents or code) and a high share of the workday with AI use | AI is built into how the work gets done |
Three rules make the rubric useful:
Fluency varies far more between teams and roles than between companies, so break every number down by department, role, manager group, location or tenure. Useful views:
Always set a minimum group size and hide any group below it, so no one can be singled out. Five to eight people is a common floor. Compare roles with roles (sales with sales, engineering with engineering) rather than holding everyone to one target. For a step-by-step view of usage by team, see our AI usage checker guide.
To tell whether training worked, measure behavior, not just course completion:
If a team's usage doesn't move after training, the problem is usually not knowledge. It may be access, unclear use cases for that role, or a manager who isn't using AI either. See our AI training blueprint for how to design training that sticks.
Improving your team's AI fluency starts with education. These courses are online and self-paced, and they suit employees at different levels:
Course Link: AI For Everyone Course

Course link: Elements of AI Course

Course Link: AI Fluency

Course Link: Introduction to Generative AI

Course Link: Applying Generative AI as a Business Professional

Each course comes at AI fluency from a different angle, from overview to hands-on use. Give employees time to take them. The goal isn't to turn everyone into AI engineers, but to make sure they understand the basics and know how to use the AI tools that matter for their role. Then measure whether usage changes, using the before and after method above.
After investing in AI skills, you need to know whether usage is actually changing. Worklytics measures this from the data your tools already have. It connects to AI tools such as Microsoft Copilot, ChatGPT Enterprise, Claude, Gemini, GitHub Copilot, Cursor and Slack AI, plus everyday work tools like Microsoft 365, Google Workspace and Slack, and turns their usage metadata into an AI fluency dashboard for your organization. It never reads prompt or message content.
Key insights Worklytics provides include:
Adoption by team and role: See which departments, roles and manager groups use AI and how often, including AI days per person counted once across all tools. You might find that engineering has high adoption while sales lags, and target training or support where it is needed.
Depth of use: Go beyond "logged in once." Worklytics measures the share of the workday in which people use AI, and classifies AI activity into work categories such as coding, research, analysis, summarization, drafting and email writing, so you can see where use is deep and where it is still shallow.
Power users at the group level: Find the teams and roles with the most intensive AI use, and see which tasks and tools they use AI for. That tells you which workflows to share with other teams. Results are only shown for groups above a minimum size, typically 5 to 8 people, so the view is about teams, not a ranking of individuals.
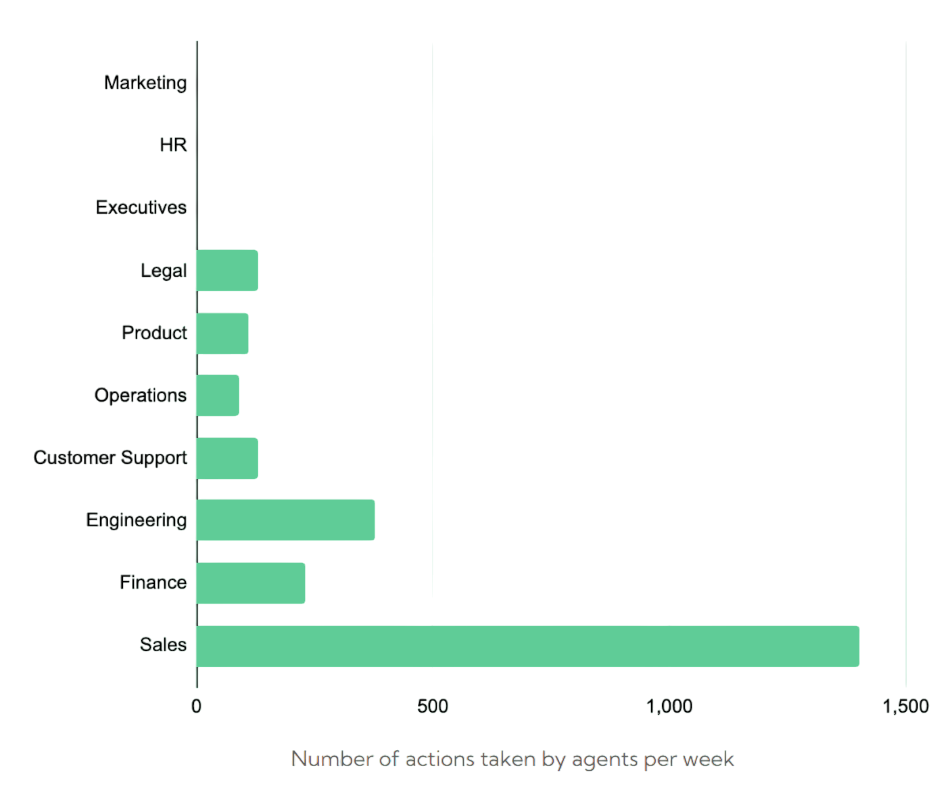
Usage trends over time: Track weekly and 28-day trends by group. If Marketing's usage rises after a generative AI workshop, you will see it. If a tool isn't catching on in one department, that shows up too.
Links to outcomes: Compare teams with high and low AI use over the same period against your own outcome metrics, and look at work patterns such as focus time and meeting load. You can also export the data to your own data warehouse or BI tools to combine it with other company data.
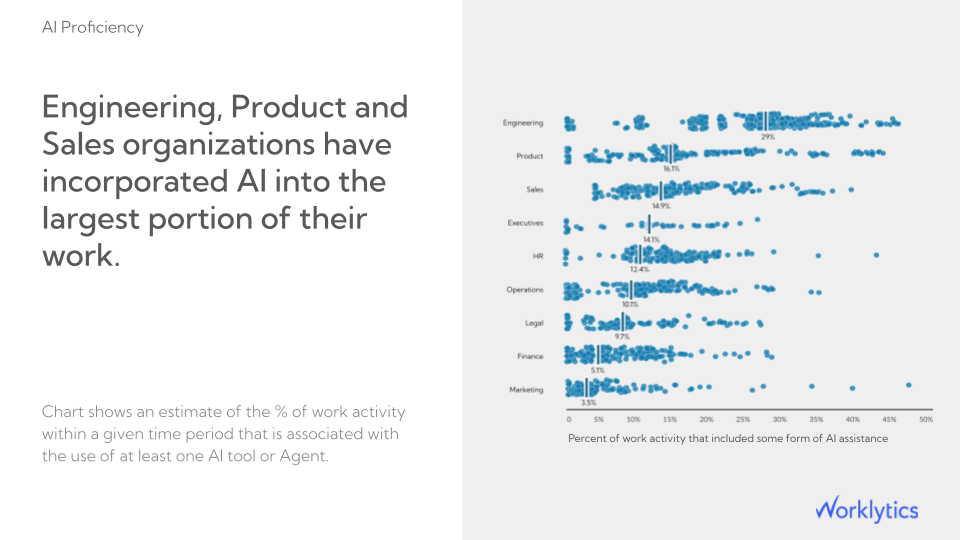
Benchmarking against peers: Peer benchmarking is available in beta, so you can compare your adoption with similar organizations.

Privacy is built in. Worklytics analyzes metadata, never message or prompt content. Personal identifiers are pseudonymized (hashed with SHA-256) before analysis, and results are only shown for groups above a minimum group size. You can see how it works on the AI adoption page.
With these measures in place, AI fluency stops being a vague goal. You can see which teams have built AI into their work, which need help, and whether training and enablement are moving the numbers. That lets you celebrate what is working, fix what isn't, and show that your AI investment is changing how work gets done.
Combine what people know about AI, from assessments or surveys, with how they actually use it, from your AI tools' usage data. Turn usage into simple levels, such as how many days in the last 28 people used AI and for how many kinds of task. Report the share of each team at each level and track it over time.
Break usage data down by department, role and manager group, and hide any group below a minimum size, often 5 to 8 people. Compare the share of each group at each fluency level, their AI days, and the mix of tasks they use AI for. Compare roles with similar roles rather than holding everyone to one target.
Record the team's AI usage for the 28 days before training, then measure again 4 to 8 weeks after. Check whether people moved up fluency levels and started using AI for more kinds of tasks, and compare with a team that hasn't been trained yet. Course completion alone doesn't show a change in how people work.
AI literacy is knowledge: understanding what AI can do and how to use it responsibly, usually measured with assessments or surveys. AI fluency is behavior: using AI regularly and productively in real work, best measured with usage data from AI tools. A team can pass an AI course and still rarely use AI day to day.
Look for the teams and roles with the highest share of people at the top fluency levels, then see which tasks and tools they use AI for. Ask those teams to share their workflows and prompts with similar teams. Keep the analysis at group level rather than ranking individuals.