The core internal mobility metrics are internal mobility rate (internal moves divided by headcount), internal fill rate (open roles filled by internal candidates), promotion rate and time to promotion. For succession planning, track bench strength, ready-now successor coverage for critical roles, successor hit rate and time to fill critical roles.
This guide gives the formula for each metric, shows how to check whether mobility is fair across groups, and covers work-pattern signals that help you spot future leaders before a role opens.
| Metric | Formula | What it tells you |
|---|---|---|
| Internal mobility rate | Employees who changed role internally (promotions plus lateral moves) in the period ÷ average headcount | How much movement there is inside the company |
| Internal fill rate | Open roles filled by internal candidates ÷ all roles filled | How often you hire from within before going outside |
| Promotion rate | Employees promoted in the period ÷ average headcount | How often people move up |
| Time to promotion | Average months in role before a promotion | Whether careers stall in some teams or levels |
| Lateral move rate | Lateral moves in the period ÷ average headcount | Whether people can build skills by moving sideways |
| Bench strength | Critical roles with at least one named successor ÷ all critical roles | How much of the leadership pipeline is covered |
| Ready-now successor coverage | Critical roles with a successor rated ready now ÷ all critical roles | How many key roles you could fill tomorrow |
| Successor hit rate | Critical roles filled by a named successor ÷ critical roles filled | Whether your succession plans are actually used |
| Time to fill critical roles | Average days from vacancy to start date for critical roles | How exposed you are when a leader leaves |
| Retention of high-potential employees | High-potential employees still employed at period end ÷ high-potential employees at period start | Whether you keep the people your plans depend on |
Report these for teams, levels and groups, not for individuals, and compare them over time.
Internal mobility involves moving employees within a company through promotions, lateral transfers or role changes. Internal mobility is a great way to move talent to roles better suited to their experience and knowledge. Overall, it helps to retain talent and reduce hiring costs. Meanwhile, succession planning involves identifying potential leaders to fill management or leadership roles in the future and developing their talent or putting them on a career track.
Internal mobility increases job satisfaction, as it shows employees that they have the potential to move up and grow in the organization. This leads to a more motivated and committed workforce. Succession planning ensures your organization is prepared for future challenges or gaps in leadership by arming you with a pipeline of employees ready to step into a leadership role.
Both practices are essential for modern businesses that want to retain and attract the best talent while also increasing overall productivity and quality of work. So, mobility and succession are important, but what metrics can help you see how effective your strategies are? Let’s start by looking at some of the traditional metrics for internal mobility.
To measure the effectiveness of internal mobility strategies, organizations traditionally rely on several key metrics. These metrics include:
The average promotion rate measures the percentage of employees in an organization promoted within a specified period of time. For instance, if you have 100 employees and 5 received promotions during the year, you would have a 5% promotion rate. There is no single benchmark: a healthy rate depends on your industry, company size and growth. Compare your rate with similar companies, and more usefully, compare it across your own teams and levels over time.
High promotion rates can indicate that you have a robust pipeline of talent and that career development and growth are readily available at your company. This helps create a culture of growth and development where employees stay because they feel recognized for their work. When there are clear paths to career advancement, you can increase retention and reduce turnover.
Frequency or time to promotion measures how long employees stay in their roles before being promoted. Again, the size of your company and your industry can affect what this average should be, but shorter promotion times can indicate a dynamic internal mobility system while longer times may reveal some obstacles employees have to moving up.
By looking at this metric, companies can identify potential bottlenecks in the promotion process and determine if something needs changing. While not every company needs to be promoting employees yearly, waiting too long between promotions can lead to employees getting disgruntled and leaving. It’s important to find a balance that works for your organization.
Lateral moves are when you move employees to different roles or give them different responsibilities at the same organization level they’re currently working in. Lateral moves are great for creating a more robust skill set for employees that can set them on a faster track to promotions and moving up in the organization.
This can also help keep employees engaged and reduce the risk of burnout as they face new challenges and dive into new opportunities. Additionally, broadening the skill sets of workers with frequent lateral moves helps your workforce to be more adaptable and versatile, as they can take on various roles and responsibilities and fill in departmental gaps as needed.
Promotions and lateral moves together make up your internal mobility rate. Definitions vary, so state yours. LinkedIn, for example, defined its internal mobility rate as the share of hires that were internal, and reported an overall rate of 19.6% between April and August 2020 (LinkedIn). Treat any outside figure as a rough reference and track your own trend.
Tracking skill development and training can help you understand how prepared your employees are for internal mobility. High participation rates in skill development courses and training programs can indicate your employees are engaged with their career futures and ready to take on bigger roles in the company.
Of course, this also requires investment on the company’s part to ensure these skill development and training resources are readily available. But, the investment is worth it, as it can increase retention rates, help employees feel supported and increase overall satisfaction - all in addition to the primary benefit of skill building.
Succession planning metrics focus on identifying and nurturing future leaders within the organization. Some metrics for succession planning include:
Your leadership pipeline strength indicates the readiness of potential leaders in your organization. You can look at the number of employees you identified as having high potential for leadership positions, along with how ready they are for their intended role. With a strong pipeline, you have a steady lineup of employees who are ready and willing to step up as soon as they’re needed. By looking at your leadership pipeline, you can see if there are any gaps and work on identifying employees who can fill those gaps.
Talent pool diversity ensures your company continues to innovate and utilize the skills and thoughts of an eclectic workforce. A diverse talent pool also indicates your organization’s commitment to inclusion.
Inclusive succession planning leads to a more adaptable and thought-diverse leadership team, making your company more competitive and a more attractive place to work for internal employees and potential hires.
Metrics that measure performance and potential look at the past achievements of employees and the abilities of these employees to take on bigger roles or responsibilities. These metrics go hand-in-hand as performance metrics reveal which employees are capable and perform at a high level, while potential metrics indicate their ability to take on new challenges and opportunities.
Finally, successor readiness looks at how prepared employees are to assume leadership roles. You can measure this metric by looking at the skills they’ve developed, the training they’ve completed and other activities that were intended to prepare them for a leadership position. If you have a detailed succession plan in place, readiness can also be measured by how far they’ve progressed in that plan.
Turn readiness into numbers you can report: bench strength (critical roles with a named successor), ready-now successor coverage (critical roles with a successor who could step in today) and successor hit rate (critical roles actually filled by a named successor). A low hit rate means plans exist on paper but are not used when roles open.

Equitable mobility means people in every group have a similar chance to move and grow. To check it:
Only report groups large enough to protect privacy, and look at the trend over several periods before drawing conclusions.
HR records show who moved. Work-pattern data helps explain why, and who is likely to be ready next. Worklytics measures the collaboration and work-pattern signals below from the metadata of work tools such as calendar, email and chat; survey and DE&I measures come from your HRIS and survey tools.
Collaboration network metrics show how people work together across the company. Worklytics measures network centrality (how much information flows through a person and how well connected they are), the number of collaborators, and cross-group collaboration (the share of collaboration time spent with other teams). At group level, these show which teams act as connectors across the organization and which are isolated, which helps succession planning look beyond the people already visible to leadership.
Diversity, equity and inclusion (DE&I) metrics go beyond traditional diversity measures to evaluate the fairness and inclusivity of organizational practices. These metrics can include representation, pay equity, promotion rates among different demographic groups and employee perceptions of inclusivity.
Monitoring these metrics makes it easier for organizations to create a more inclusive and equitable workplace, where all employees have the opportunity to succeed and advance.
Employee satisfaction data can give you valuable insights into employee happiness and overall workplace satisfaction. This data is often tied to how employees feel valued in the organization. Tracking benefits, promotions, bonuses and other things employees care about shows you’re invested in their internal mobility and succession. Looking at employee satisfaction data can also show where improvements need to be made to better align the workplace with employee expectations and needs, so they stay around long enough to move up.
Work-life balance metrics evaluate how much time and effort employees spend at work compared to their personal lives. Data on after-hours meetings and chat messages, meeting load and time since vacation (from your HR system) can indicate if teams are overworked. By identifying these issues, you can support employees and prevent burnout and turnover.
Promoting a healthy work-life balance leads to better retention, which means more internal mobility and keeping employees who could step into leadership positions.
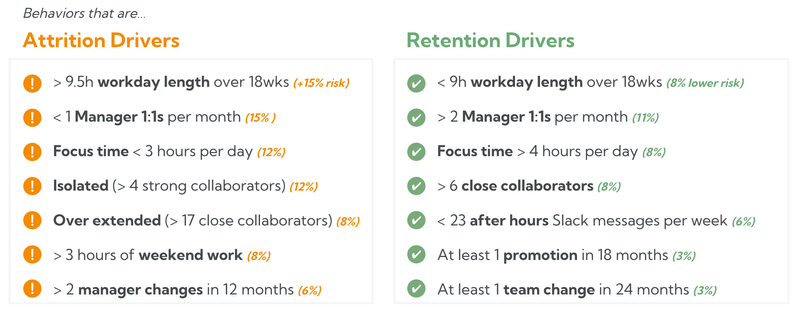
Work engagement metrics can help give insight into how engaged and committed employees are toward their work and the company. Highly engaged employees are typically more productive and more likely to stay at the company for the long term. Tracking work-pattern metrics such as focus time, time since the last 1:1 with a manager and collaboration trends, alongside engagement surveys, shows which teams have the conditions people need to grow.
Key performance indicators (KPIs) across the employee life cycle, such as onboarding success, time-to-productivity and retention rates, provide a comprehensive view of the employee experience. These metrics can identify areas where the employee experience can be improved, in turn improving internal mobility and succession outcomes.
When you compare internal mobility software or analytics vendors, check:
Traditional metrics have their place in internal mobility and succession planning strategies, but they don’t paint a complete picture. Fortunately, workplace analytics software like Worklytics can provide modern metrics for next-level workforce planning. With in-depth data analytics and insights, you can better understand your workforce as a whole and determine how robust your internal mobility and succession planning is.
Worklytics connects to over 25 workplace tools and turns their metadata into more than 400 metrics, including collaboration network measures, manager 1:1 frequency, cross-group collaboration and after-hours work. It never reads the content of emails or messages. Personal identifiers are pseudonymized (hashed with SHA-256) before analysis, and results are shown only for groups above a minimum size, typically 5 to 8 people. You can stream the metrics to your data warehouse or BI tools and combine them with the HRIS and succession data you already have. See how it works.
Book a demo to learn more.
Start with a few metrics from your HRIS: internal mobility rate, internal fill rate, promotion rate and time to promotion. Define each one in writing, report it by team, level and group, and review the trend every quarter. Add work-pattern data such as collaboration across teams and manager 1:1 frequency to explain why some teams move people more than others.
Internal mobility rate is the number of employees who changed role inside the company (promotions plus lateral moves) in a period, divided by average headcount. Some reports instead use the share of all hires that were internal, so state which definition you use. Compare your own trend over time and across teams rather than relying on one outside benchmark.
Calculate promotion rate, internal mobility rate and time to promotion for each group, then compare each group with the overall rate or the highest group's rate. Do the same for who is named as a successor and who is rated ready now. Only report groups large enough to protect privacy, and watch the trend over several periods.
The main succession planning KPIs are bench strength (critical roles with a named successor), ready-now successor coverage, successor hit rate (critical roles filled by a named successor), time to fill critical roles and retention of high-potential employees. Together they show whether you have a pipeline, whether it is ready, and whether you use it.
Join learning records (courses completed, skills gained, certifications) to your HRIS promotion and move history. Then check which learning activities came before successful moves, and use them as readiness signals for people in similar roles. Treat these as signals for a conversation with the manager, not as automatic decisions.