
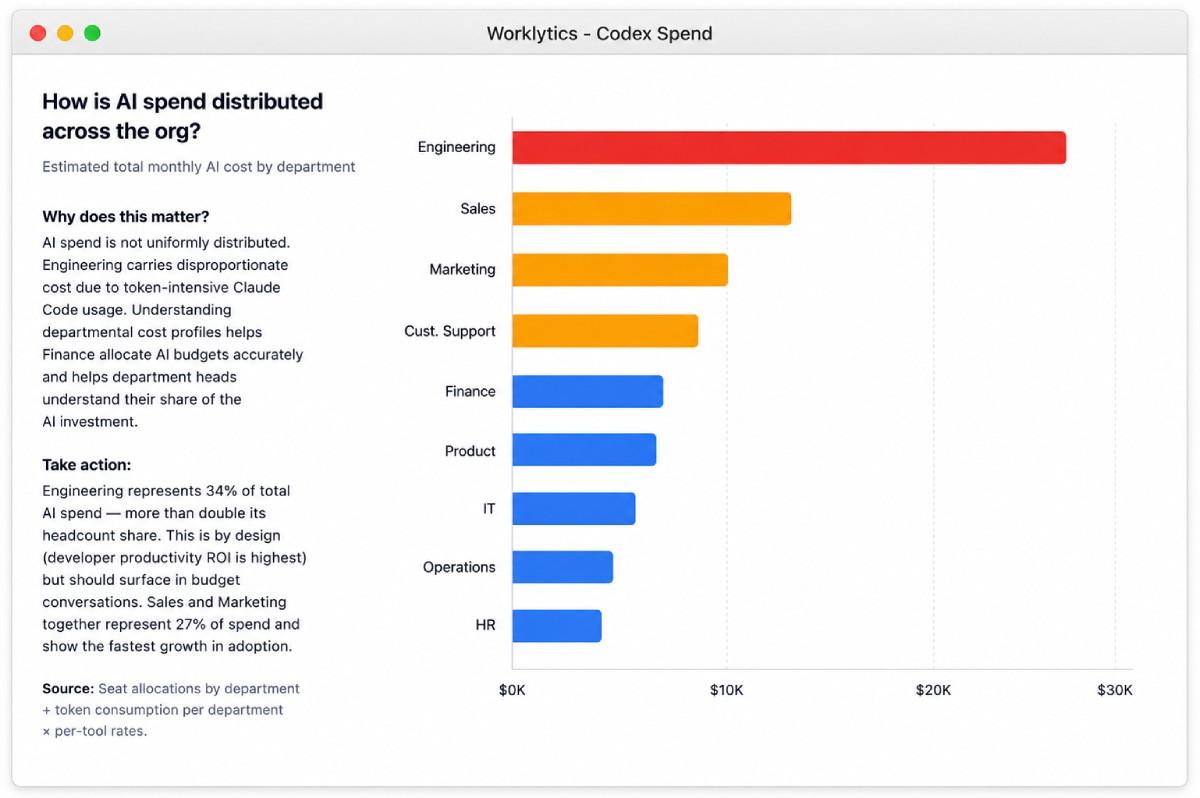
A clean export answers one question "how many credits did we burn" and immediately raises harder ones. Who should be charged for them? Did the spend produce anything? Is the level reasonable, or just familiar? None of those are export problems. They are analysis problems, and they are where a credit total either becomes a management decision or stays a line in a finance tab.
The metric that makes Codex spend judgeable is unit cost: dollars per completed task, and ultimately per merged pull request, tracked next to the engineering time it saved. Getting there means resisting the two easy mistakes — ranking developers by raw credits, and reading a rising invoice as either good news or bad without decomposing it. This guide walks through the analysis in the order the questions usually arrive. It assumes you already have a clean, joined dataset; if you don't, start with the companion guide, How to Export Codex Spend Data.
The rate card prices three token classes separately: input tokens, cached input tokens, and output tokens. That third distinction is the one most spend analyses ignore, and it breaks the assumption that credits scale linearly with how much context a session touches.
Codex reloads repository context, agent instruction files, and tool definitions on every session. When a developer works in sustained sessions against the same repository, much of that context is served from cache and priced on the cached line. When the same developer works in short scattered sessions, the identical context is re-paid at the uncached rate each time. Session shape, not session volume, drives a meaningful share of the credit difference between two engineers doing comparable work.
Two consequences follow, and both affect how you should read the numbers.
First, credits per developer is not comparable across teams working in repositories of different sizes. A team whose repository carries a large instruction file starts every session with more input tokens than a team whose repository does not, before either writes a prompt. Ranking engineers by credits consumed without normalizing for that is ranking them partly by which codebase they were assigned to.
Second, cost reduction has a configuration lever that is invisible in a spend report. If cached input is a small share of total input tokens, sessions are being started and abandoned rather than sustained, and the fix is a working-pattern change rather than a licensing change. This is exactly why the export should keep the token classes separate — sum them and the ratio that reveals it is gone.
Cost allocation fails politically more often than technically. A department head handed a Codex invoice line will contest it unless they can see the activity that produced the number and compare it to peers on equal terms.
Worklytics builds the department view from usage data rather than from seat assignment, so cost attributed to a team reflects what that team consumed. Allocation sits alongside adoption and depth metrics from the same period, which turns a billing conversation into a utilization conversation.
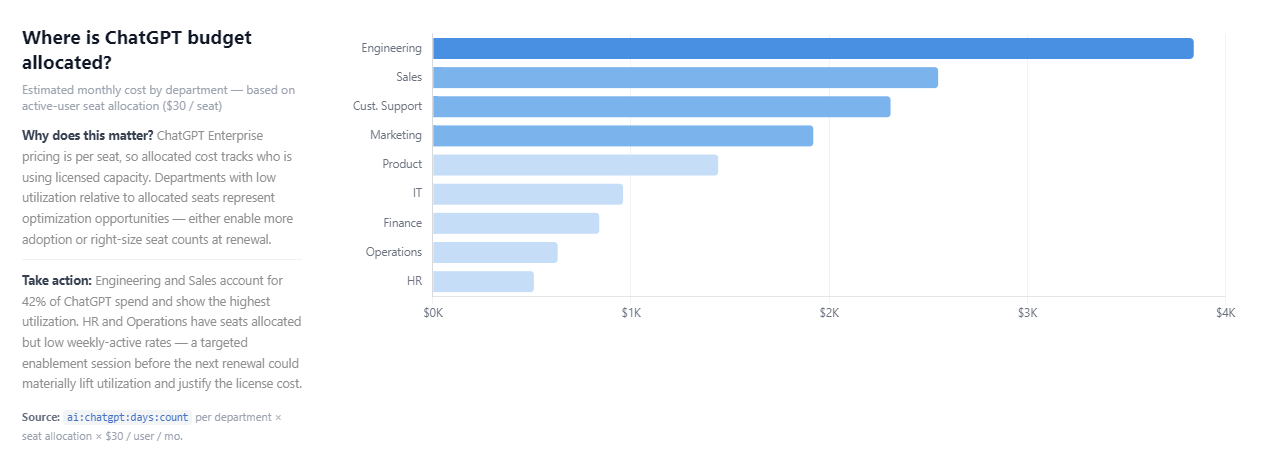
The pattern this surfaces is departments holding allocated seats against low weekly-active rates. Those seats carry cost without producing signal, which is a right-sizing decision at renewal or an enablement decision before it, and it is only visible when allocated cost and active usage sit in the same table.
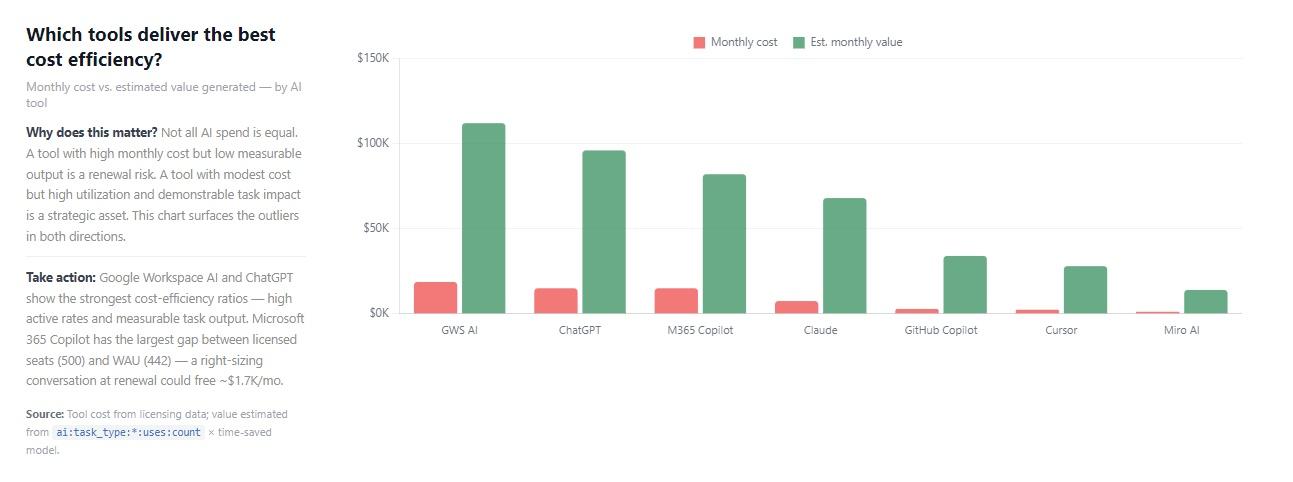
Cost efficiency is the more useful framing than cost alone, because it separates two situations that look identical on an invoice. A tool with high monthly cost and low measurable output is a renewal risk. A tool with modest cost and high utilization is a strategic asset. Engineering routinely carries a disproportionate share of AI spend because agentic coding is token-intensive, which is defensible when the return is measured and indefensible when it is assumed.
Rising Codex spend has two very different causes. More people using Codex is adoption. The same people consuming more per session is intensity. They call for opposite responses, and a spend chart alone cannot distinguish them.
The Worklytics AI adoption dashboard reports activation breadth and usage frequency as separate series, so a cost increase can be decomposed before anyone reacts to it.

The decomposition changes the recommendation. If spend grew because activation moved from 40 percent to 60 percent of licensed engineers, cost per developer is falling even as the invoice rises, and the correct action is to keep going. If spend grew while activation held flat, a small group absorbed the increase, and the question becomes whether their work justifies it or whether a model default needs changing.
Codex spend is an adoption-stage signal. It confirms uptake is happening. It says nothing about the two stages that determine return, which is why organizations that stop at spend reporting cannot answer the ROI question when it arrives.
The question that ends every Codex budget review is whether the spend produced anything. Activity metrics cannot answer it, because threads, turns, and credits all measure effort rather than result.
Worklytics productivity measurement classifies AI-assisted activity into work categories and estimates time returned per category, so Codex spend can be set against the specific work it accelerated.
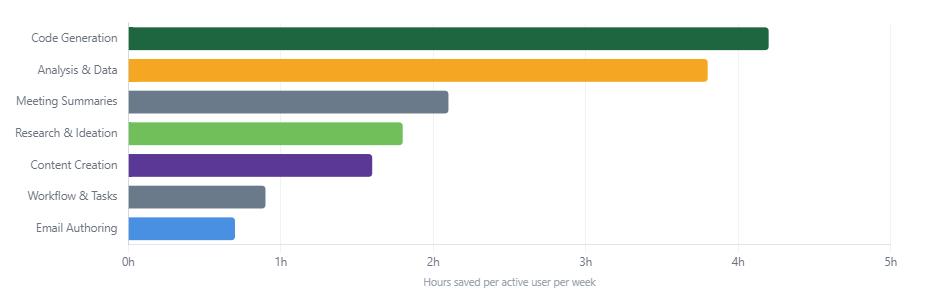
In Worklytics sample reporting, code generation shows the largest per-user time saving of any category, which is the expected result for an agentic coding tool and part of why Codex spend concentrated in engineering is usually the healthiest spend in an AI portfolio. The diagnostic value sits in the exceptions. Codex credits accumulating in a function whose time-saved profile is dominated by email and meeting summaries points to a licensing mismatch rather than a productivity gain.
An internal trend answers whether spend is rising. It cannot answer whether the level is reasonable, which is the question a board asks. Without an external reference, organizations default to comparing against their own previous month, which normalizes whatever they started with.
Worklytics Benchmark reports peer distributions with decile values rather than single averages, so a metric lands at a percentile and inside a normal range instead of arriving as a bare number. Applied to AI metrics, total adoption, weekly usage intensity, and agent breadth each get a position rather than a value.
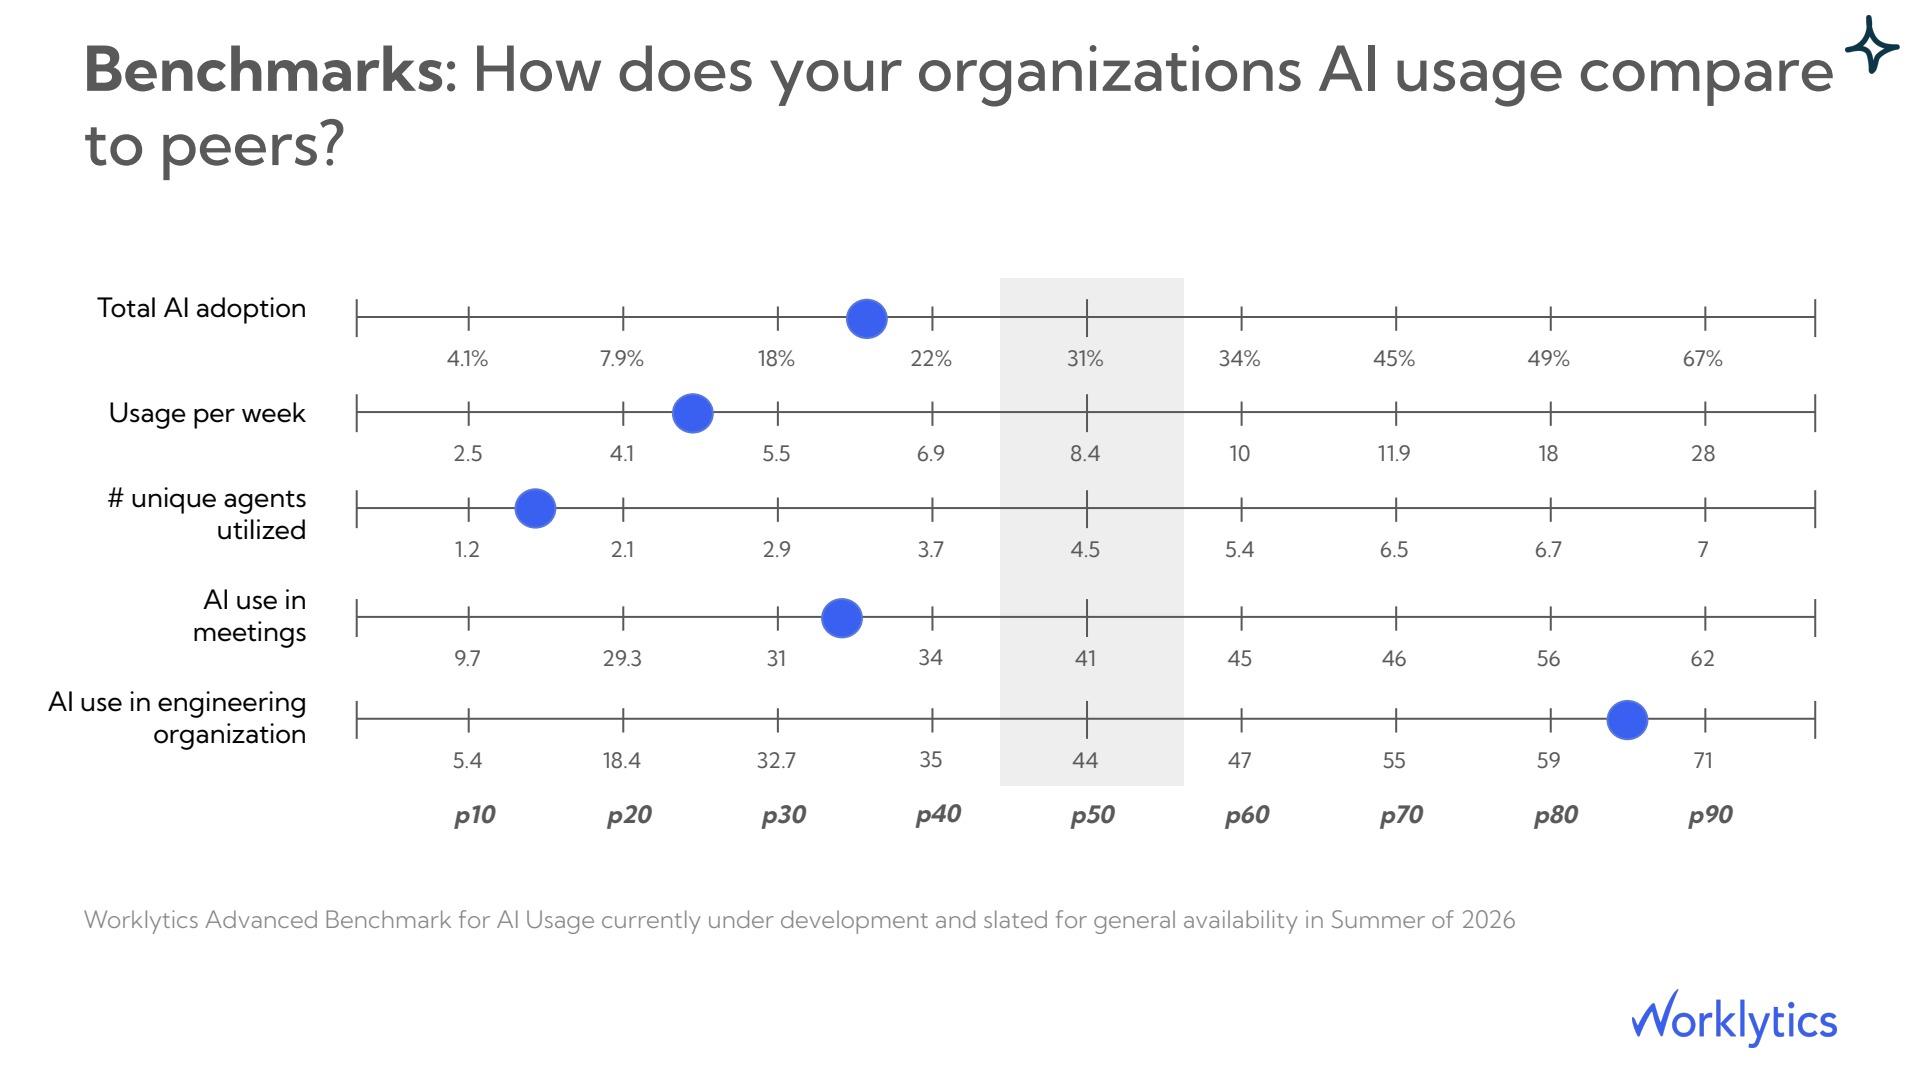
Percentile placement changes which lever you pull. An organization at the median on total adoption but low on unique agents utilized has a breadth problem, and adding Codex credits will not fix it. An organization high on adoption and low on weekly usage has a habit problem, where the fix is workflow integration rather than licensing.
Most engineering organizations do not run a single assistant. The same analysis that makes Codex spend legible — normalize the identity, separate the surfaces, hold cost against output — is also what lets you compare Codex against Claude Code and Cursor on equal terms. Comparing tools on their own native dashboards compares different definitions of an active user, which is how consolidation decisions get made on bad data.
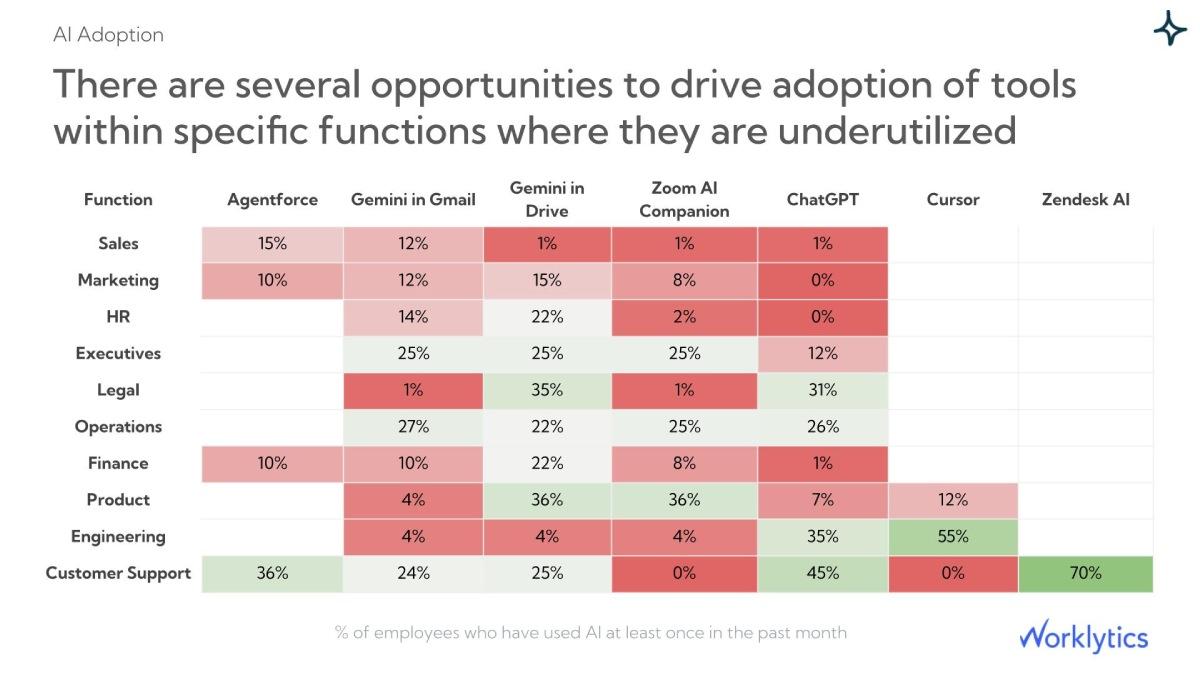
To put cost per team next to adoption, session depth, and delivered output in a single view, the Worklytics workplace insights dashboard is where that assembly happens, and the AI ROI calculator gives a first-pass estimate before an integration exists. Because Worklytics analyzes usage metadata rather than prompt or output content, the per-team analysis holds up under works-council and privacy review.
No. Credits measure consumption, not capability. Two developers with identical credit consumption can produce very different amounts of merged work depending on session depth and task selection. Proficiency requires depth metrics and output signals, which is why Worklytics reports adoption, proficiency, and leverage as three separate stages rather than one score.
Because the rate card prices cached input tokens separately from fresh input tokens. A developer working in sustained sessions against one repository serves most context from cache; a developer working in short scattered sessions re-pays the uncached rate for the same context each time. The difference is session shape, not effort, which is why raw credits are a poor basis for ranking engineers.
Set it against output and against a peer benchmark, not against last month. Concentrated spend in engineering is usually the healthiest spend in an AI portfolio because code generation returns the most time per user. It becomes a question only when high cost sits next to low weekly-active usage, or when credits accumulate in work the tool is not suited to accelerate.
Adoption tracking answers who is using Codex and on which surfaces. Spend analysis answers what that usage costs, how it allocates across teams, and whether the return justifies it. The companion guide on tracking Codex usage across your engineering org covers the adoption side in full.
Start with three numbers per function: total spend, spend per weekly active user, and the share of licensed engineers with any weekly activity. Those three separate a genuine cost problem from an adoption gap dressed up as one, and they are enough to decide where the deeper analysis is worth running.



