
Improving developer productivity is a common goal, and a hard one to deliver against. The metrics that engineering leaders have historically reached for (lines of code, commits, story points, tickets closed) measure output, not the conditions that produce it. They are easy to game, demotivating to good engineers, and rarely correlate with the outcomes the business actually cares about.
Developer experience metrics, often shortened to DevEx metrics, take a different approach. Instead of counting what comes out of the pipeline, they measure the conditions inside it: the speed of feedback, the load on the developer's attention, the time available for focused work. This guide covers the three frameworks every engineering leader should know, the specific metrics worth tracking under each, and how AI coding tools are reshaping DevEx measurement in 2026.
Quick answer
Developer experience (DevEx) metrics measure the conditions of daily engineering work across three dimensions: feedback loops (how fast code moves through review, build, and deploy), cognitive load (the mental effort required to ship), and flow state (the ability to focus without interruption). Together they explain why output metrics alone cannot predict team performance.
DORA and SPACE have moved the conversation forward, but they get misapplied. When organizations use them to count output (lines of code, commits merged, tickets closed), the metrics become a poor proxy for productivity. The Pragmatic Engineer's response to McKinsey's 2023 developer productivity article catalogued the failure modes: output metrics incentivize gaming and demotivate top performers. Writing less code, or deleting code, is often the most productive action.
Experience metrics shift the focus to causation. A team with low deployment frequency is rarely lazy. They are usually waiting on an approval, a flaky test, or a teammate eight hours behind in another time zone.
Gartner reports that 78 percent of organizations have a formal DevEx initiative established or planned. The category has moved from optional to expected.
Three frameworks dominate the conversation. They are complementary, not competing, and most mature teams use elements of all three.
DORA (DevOps Research and Assessment) produced four metrics that became the industry default for delivery performance:
DORA metrics are objective and pullable straight from CI/CD systems. Their limitation is they tell you what is happening, not why. A slower deployment frequency might mean burnout, or it might mean the team is shipping bigger, more thoughtful releases. DORA alone cannot tell you which.
SPACE was introduced in 2021 by Nicole Forsgren, Margaret-Anne Storey, and colleagues at Microsoft Research as a deliberate counter to single-metric thinking. It covers five dimensions: Satisfaction and well-being, Performance, Activity, Communication and collaboration, and Efficiency and flow.
SPACE matters because it treats satisfaction and team collaboration as first-class measurements rather than soft accompaniment. The communication and collaboration dimension in particular is where most organizations have the least visibility, and where most friction hides.
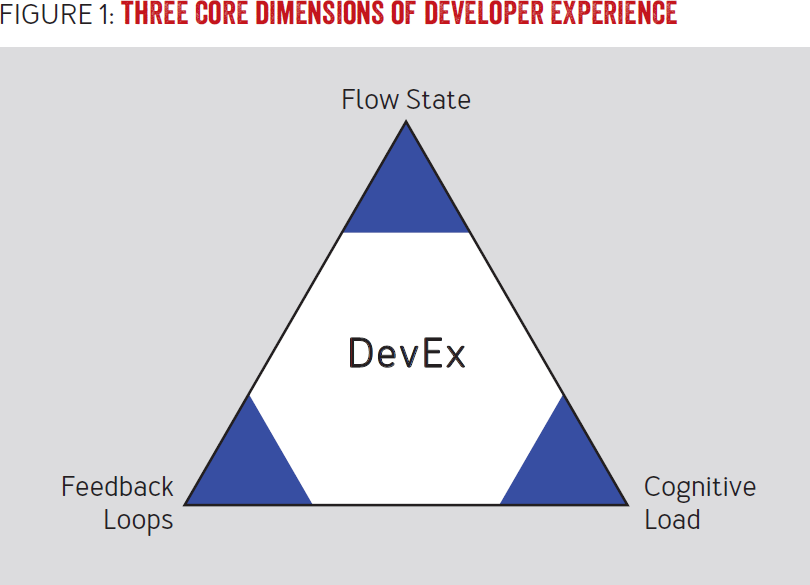
In 2023, Abi Noda, Margaret-Anne Storey, Nicole Forsgren, and Michaela Greiler published "DevEx: What Actually Drives Productivity" in ACM Queue. Their framework distills the experience into three practical dimensions:
This is the most actionable of the three because each dimension maps to something a leader can change. Slow CI is a feedback loop problem. A confusing internal platform is a cognitive load problem. A calendar full of status meetings is a flow state problem.
Here is how the three frameworks compare:
The rest of this post focuses on the DevEx framework's three dimensions, with specific metrics under each. For a deeper dive into DORA on its own, see DORA metrics alternatives.
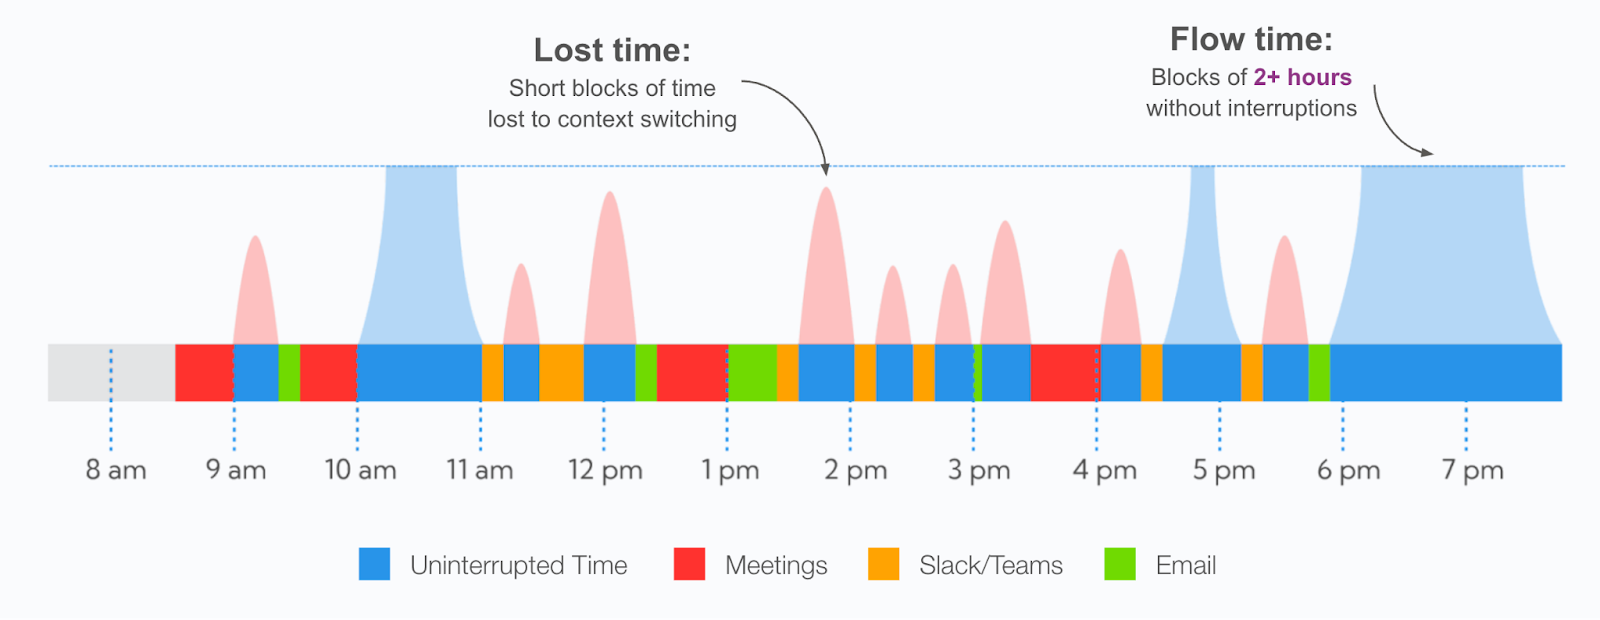
Solving complex technical problems requires deep focus, or flow state, for extended periods. In most organizations, that time is hard to find. Interruptions from meetings, Slack, Teams, and email drive context switching, and these interruptions are tractable to measure.
Microsoft and GitHub's Developer Experience Lab, in research drawing on more than 2,000 developers, found that developers with dedicated deep work time reported 50 percent higher productivity, and those who found their work engaging reported 30 percent higher.
Below is an illustration of the day in the life of a typical software developer and the interruptions to flow:
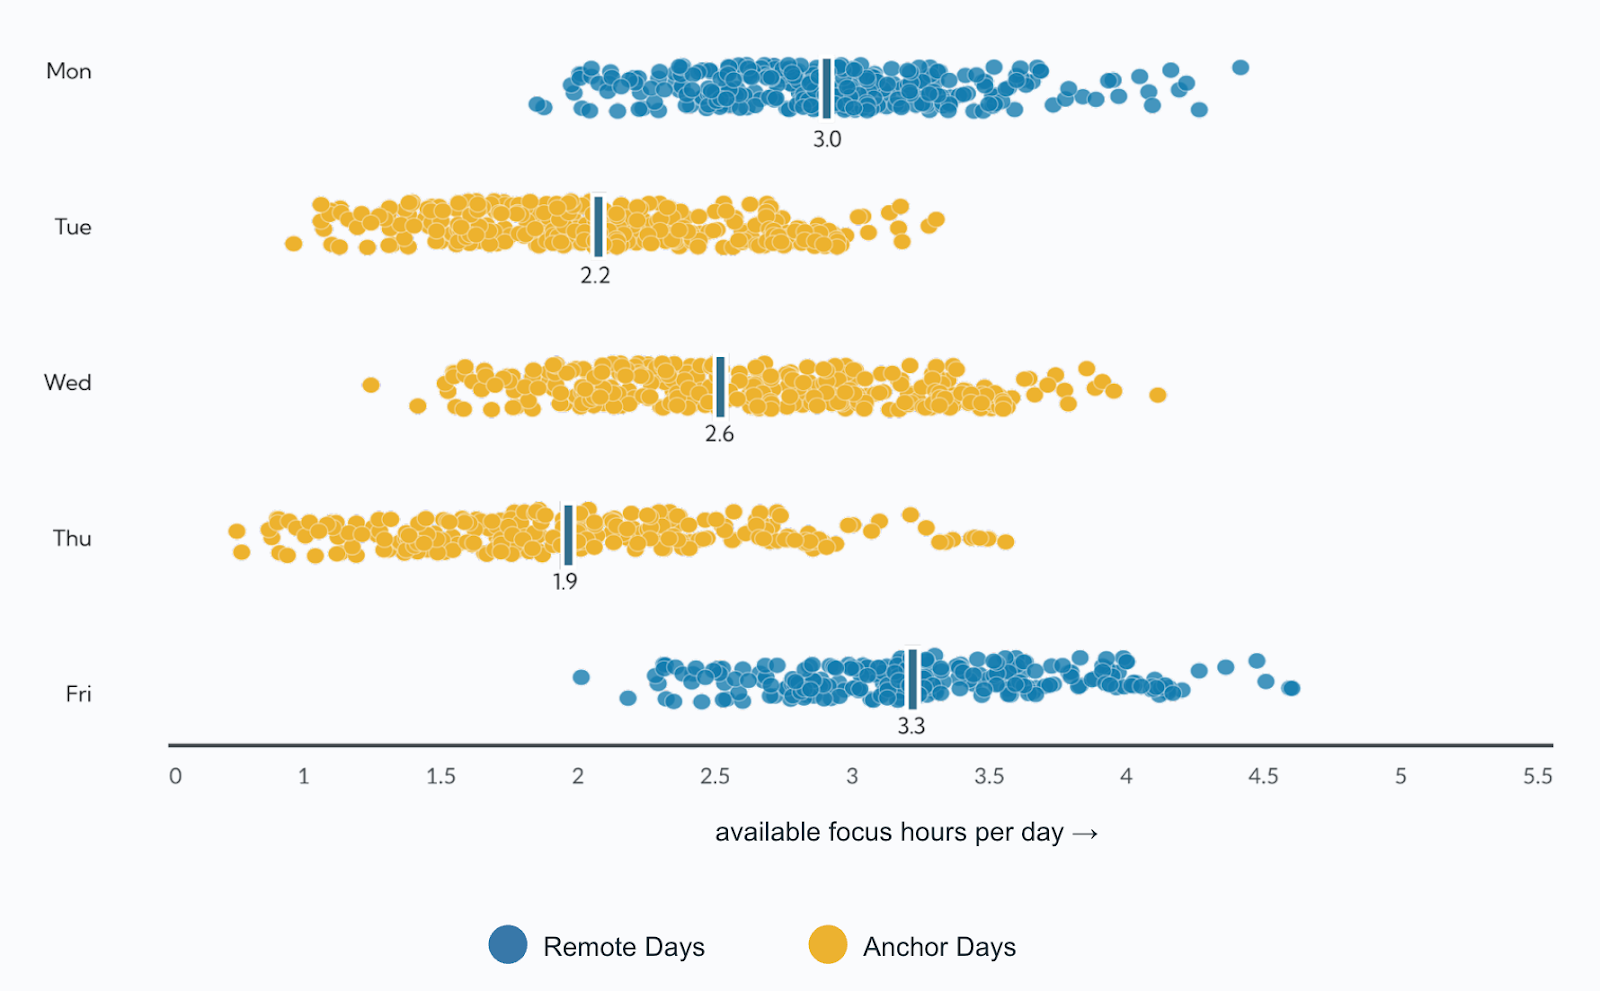
Combining this with self-reported developer productivity data shows that the amount of time available for focus is a significant driver of perceived productivity:
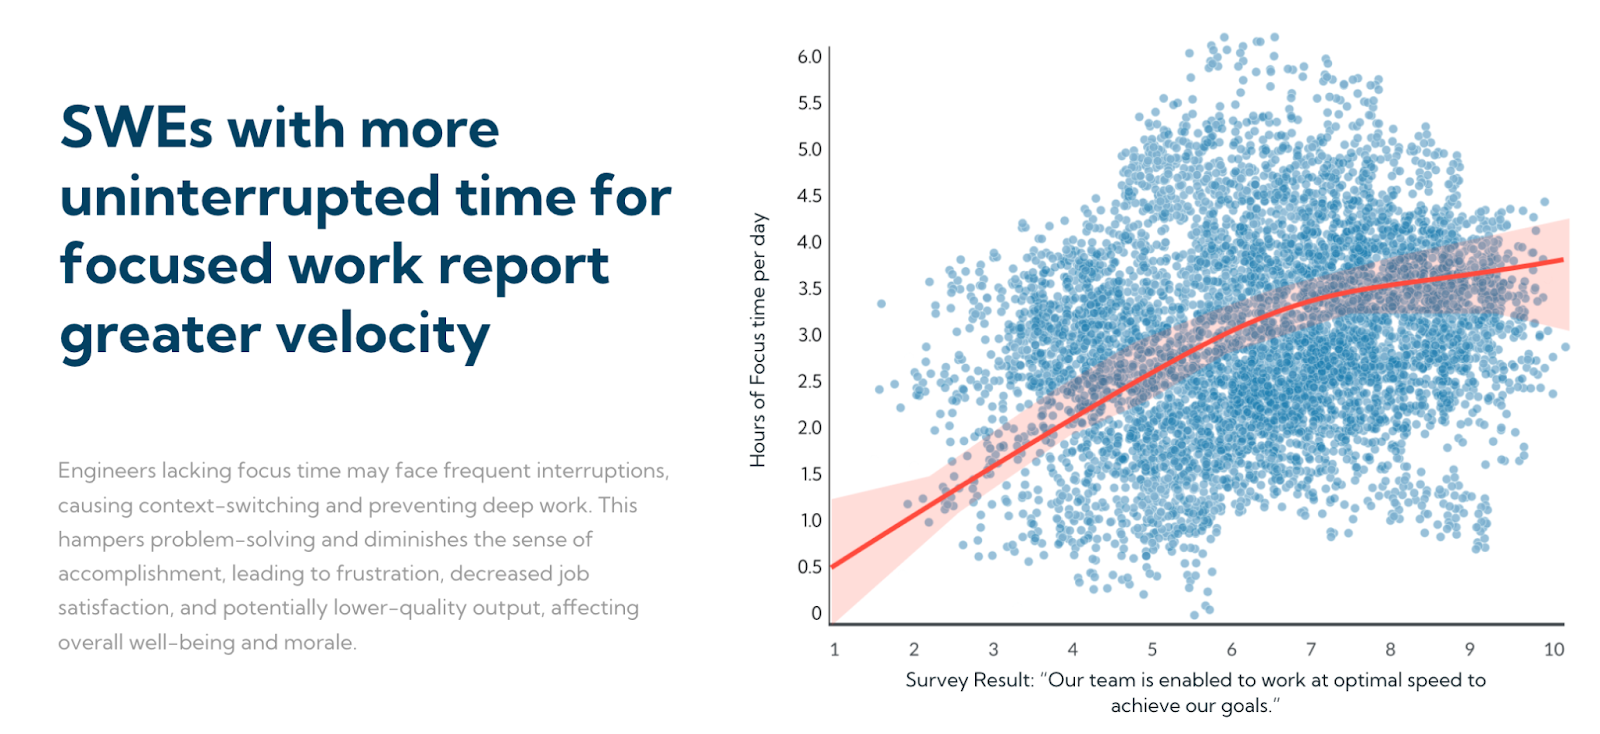
One related finding: bringing developers back to the office tends to increase disruption and lower focus on those days. Developers often report lower productivity after the implementation of return-to-office programs.
Specific flow state metrics worth tracking:
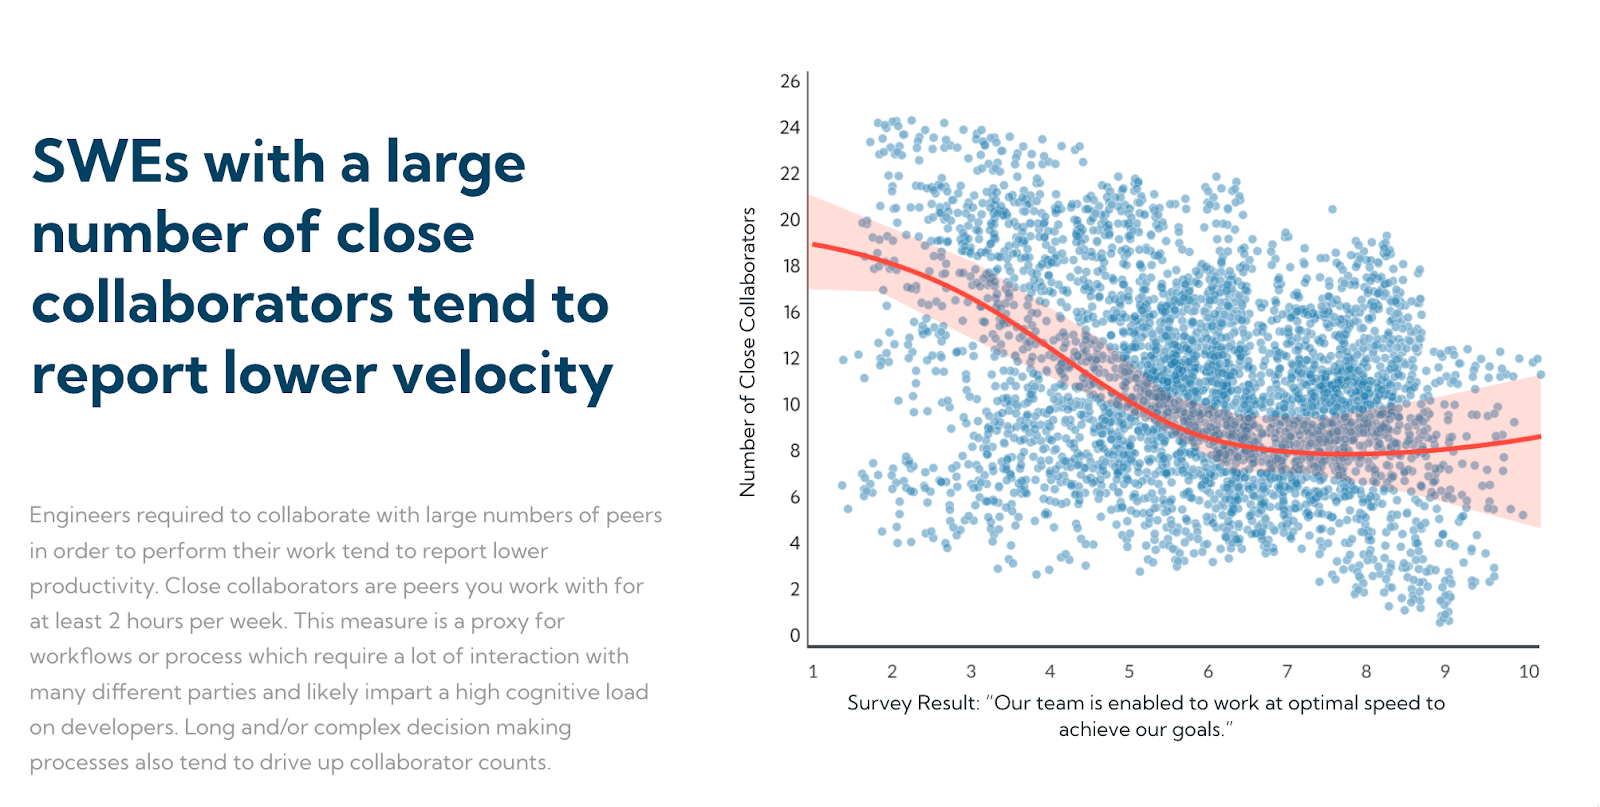
Cognitive load is the mental processing required for a developer to perform their work. Complex approval processes, sprawling internal services, and unclear documentation all add to the load. Reducing it is one of the highest-leverage things an engineering organization can do.
A useful proxy is collaborator count: how many distinct people a developer interacts with to get work done. Past 7 or 8 people per week, developers tend to report struggling to be productive.
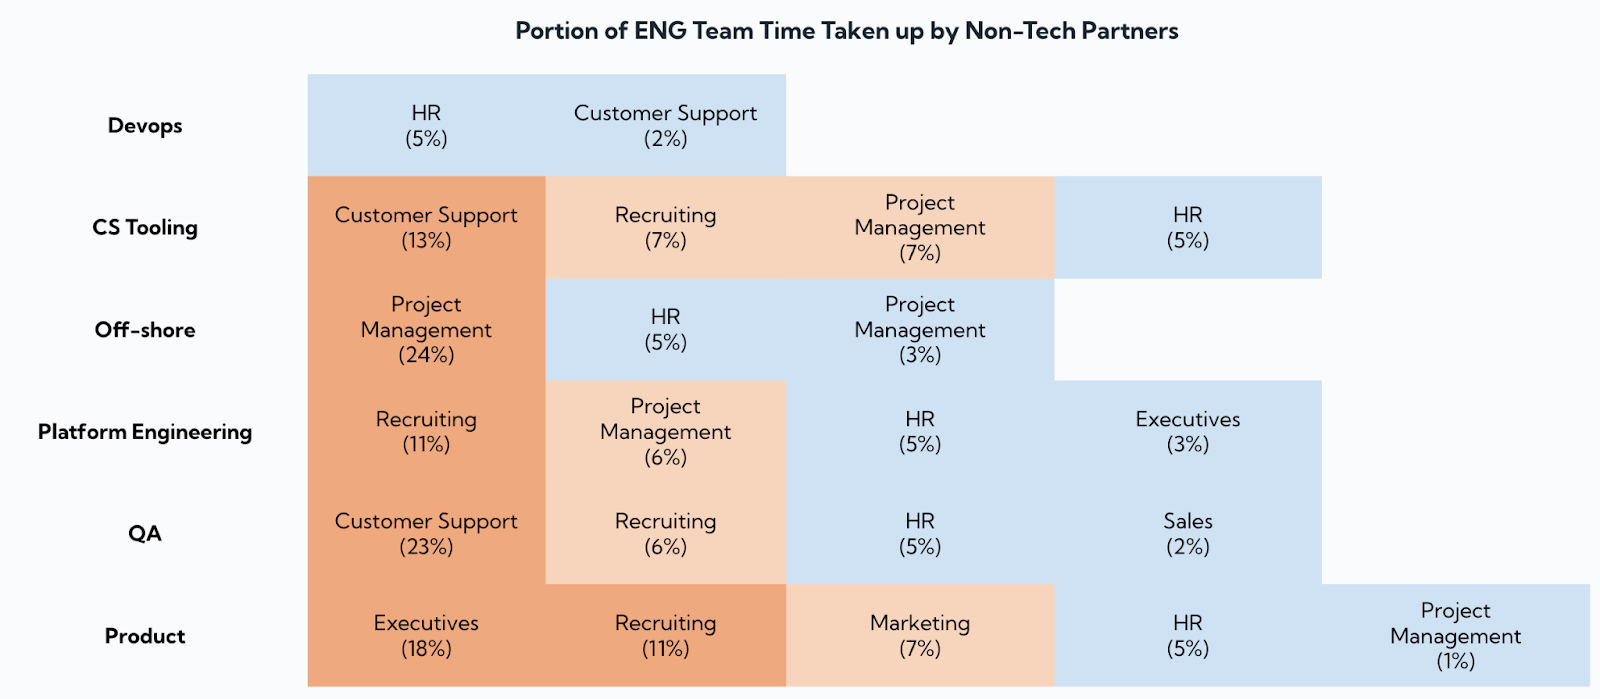
Cross-functional collaboration adds load similarly. When engineers are frequently asked to work with colleagues outside their department, it becomes a drag on velocity.
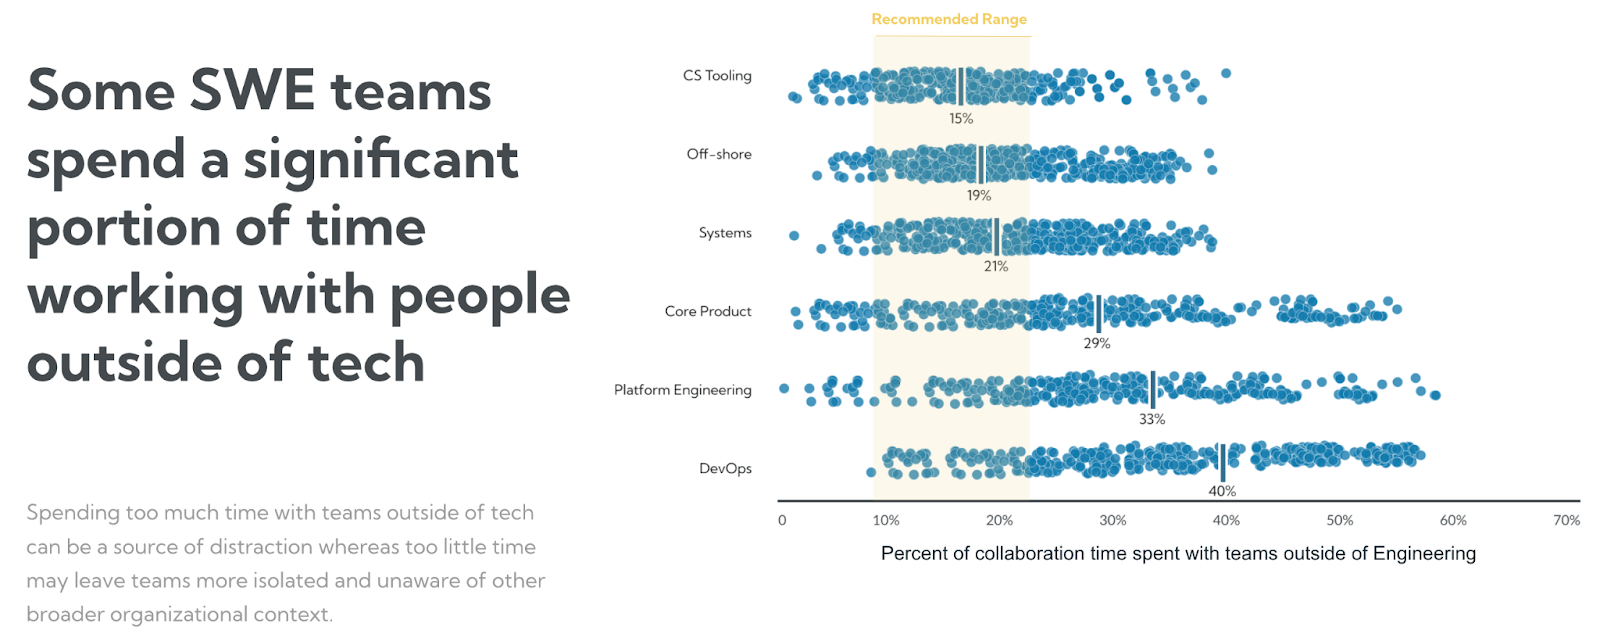
To make this actionable, look at what percent of a developer's week is going to cross-functional collaboration. That breakdown shows where the load is coming from and where developers might be over-allocated to other teams' priorities.
Specific cognitive load metrics worth tracking:
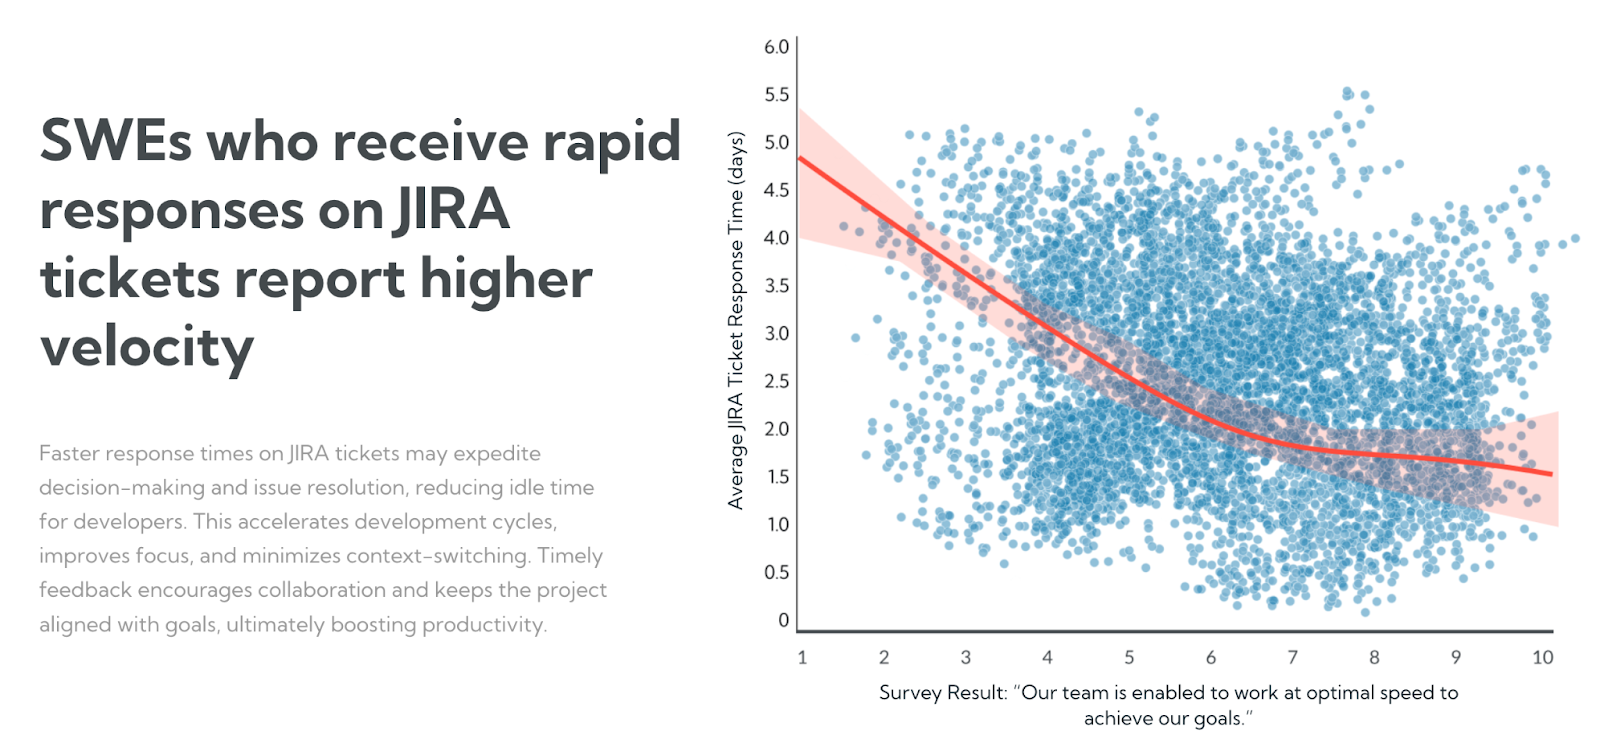
Feedback loops are the speed and quality of responses to development work. A typical day involves dozens of iterative tasks woven together by feedback from product, peers, automated systems, and customers. Research consistently shows that shortening these loops drives productivity. Stripe's Developer Coefficient study found developers spend more than 17 hours per week on maintenance work and technical debt, time that fast feedback loops can reclaim.
Many of these loops can be quantified. The product-to-engineering loop, for instance, can be measured by how quickly the product team responds to questions on Jira tickets. Faster response times correlate consistently with higher perceived developer productivity.
Code review and feedback cycles are equally measurable, and they often surface the largest source of waste in distributed teams:
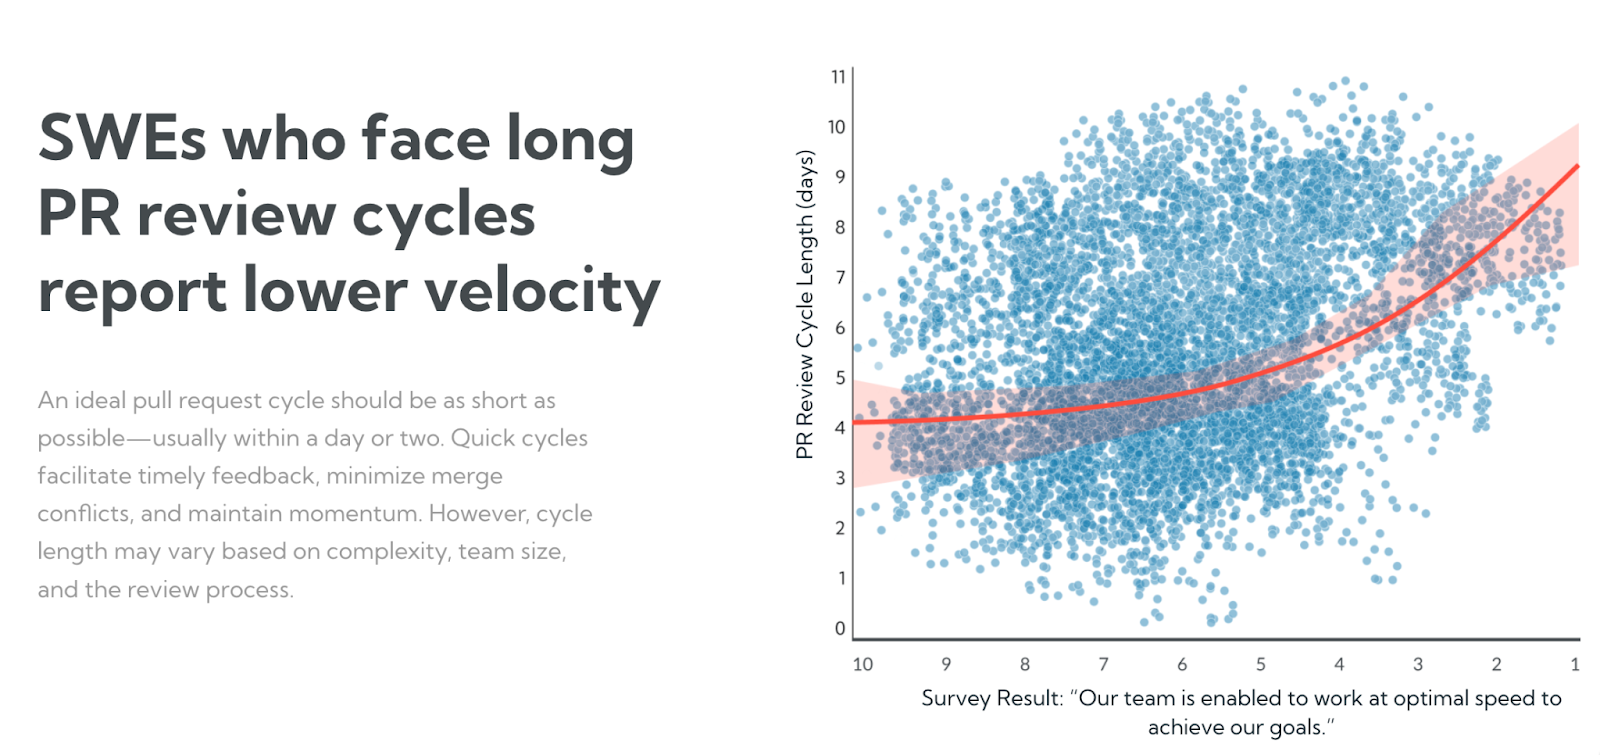
Specific feedback loop metrics worth tracking:
AI assistants like GitHub Copilot, Cursor, and Claude Code have reshaped the inner development loop. Traditional output metrics get noisier in this environment: a developer who accepts a Copilot suggestion adds more lines per hour than they would have hand-typed, but that does not mean they are more productive. Lines of code was already weak. It is now actively misleading.
AI adoption itself becomes a DevEx metric. Whether developers use the AI tools the company pays for, which use cases they trust the tools with, and how much time they report saving are leading indicators of how a team will perform over the next year. Engineering leaders increasingly track:
DX's AI Measurement Framework formalizes this by splitting AI measurement into utilization, impact, and cost. As with all DevEx data, team-level aggregation matters more for AI metrics than anything else: individual measurement creates surveillance pressure that drives the wrong behavior fast.
Developers are right to be suspicious of new metrics. Lines of code, story points, and commit counts were all introduced with reasonable intent and ended up rewarding the wrong behavior. A DevEx program that survives the first year follows a few non-negotiables:
A complete DevEx measurement program connects four data sources: version control (GitHub, GitLab), project tracking (Jira, Linear), CI/CD systems, and the collaboration layer (calendar, Slack, Teams). The first three are standard. The fourth is where most programs come up short. Flow state, cross-functional collaboration overhead, and meeting load all live in collaboration data and cannot be inferred from PR history alone.
Platforms in this space emphasize different parts of the picture. DX leads with surveys and the Developer Experience Index. LinearB and Jellyfish lead with version control and project tracking. Worklytics leads with collaboration data, pulling anonymized signals from calendar, chat, GitHub, and Jira into a team-level view so the human dimensions sit next to the delivery ones. The tradeoff: the collaboration layer requires those integrations to be in place and a privacy review that supports them. For teams without that foundation, developer surveys and pipeline telemetry are the lower-friction entry point.
Whichever platform a team picks, the principles hold: measure conditions, aggregate at the team level, pair quantitative signals with surveys.
Developer productivity is the output of the system: features shipped, deployments completed, incidents resolved. Developer experience is the condition of the system that produces that output: the speed of feedback, the load on the developer's attention, and the quality of the daily work environment. Productivity is the result. Experience is the cause.
Start with three: PR cycle time (a feedback loop signal), self-reported focus time per week (a flow state signal), and a quarterly developer satisfaction survey with three to five questions. This combination is cheap to set up, hard to game, and produces a useful baseline within one quarter. Add more once the first three are stable and trusted.
Twice a year is the standard cadence for comprehensive surveys, with shorter monthly pulse checks of three or four questions in between. Stripe and Uber both publicly use a half-year cadence on rotating samples to keep response rates high. Quarterly is acceptable for the comprehensive version, but more frequent surveying typically produces fatigue and declining response quality.
Not well. System telemetry tells you that CI builds take 14 minutes. It does not tell you whether that feels slow to the team or whether the slow part is actually waiting for a code review afterward. Surveys are where the experience part of developer experience lives. Skipping them produces a dashboard that looks complete but answers the wrong questions.
Yes, as a foundation. DORA metrics remain the cleanest measurement of delivery performance, and the four core metrics are the right starting point for any new measurement program. What has changed is that DORA is no longer sufficient on its own. Most mature teams now pair DORA with SPACE or the DevEx framework to capture the human dimensions DORA was never designed to address.
Useful DevEx programs are built one signal at a time. Start with one metric from each dimension, layer in a quarterly survey, and resist the temptation to ship a 19-metric dashboard in the first quarter. Trust accrues slowly and breaks fast. For a deeper look at the metrics Worklytics uses across calendar, chat, GitHub, and Jira data, see the engineering effectiveness report. Related reading: how to build high-performing software engineering teams and GitHub engagement analytics.


