

In today's digital workplace, teams are more connected than ever—Slack messages, channels, huddles, and pings fly around the clock. But more communication doesn't equate to better collaboration. In fact, many companies are discovering the opposite: that over-communication and fragmented messaging patterns can quietly erode productivity.
Teams fall into chaotic patterns when collaboration is reactive—ping-driven, unstructured, and without visibility. Leaders can't see where bottlenecks are forming, and employees struggle to maintain focus or distribute workload evenly. Without the correct data, companies are essentially flying blind in their most critical work.
That's where Slack dashboards begin to add value. They provide surface-level insight into messaging patterns that can help teams realign, streamline, and take control of collaboration dynamics.
Getting visibility into Slack begins with accessing the Slack Analytics Dashboard – a built-in feature for Slack workspaces. Here's how to find it and what to expect:
Slack's built-in Analytics Dashboard gives a quantitative peek into your digital office. Key stats include Total Messages Sent, which covers all messages across channels and DMs. Slack's native analytics answer basic questions: who is active, where conversations happen, and how much chatter is happening.
What's Missing: While these metrics are useful, they lack context about outcomes or quality. Slack analytics show activity but not the impact of that activity. Slack metrics don't reveal behavior patterns like after-hours messaging or focus time fragmentation unless you export the data for deeper analysis. And, of course, Slack's dashboard doesn't read the content of messages, so it can't judge sentiment or topic (e.g., whether a channel's chatter is work-related or off-topic).
That's why many teams use Slack's built-in analytics as a starting point. However, you may need to dig deeper or bring in additional data to get actionable insight.
Not every statistic in Slack's dashboard is meaningful to executives or HR leaders seeking actionable insights. Let's focus on a few high-impact metrics and how to interpret them regarding team productivity.
Active Channels: Pay attention to how many channels are actually active and which ones they are. An "active" channel might be defined as having regular messages (e.g., daily or weekly posts). Slack's analytics will show the total number of channels and per-channel message counts. If your workspace has too few active channels, it could indicate that the conversation is too concentrated. On the other hand, too many channels with only trickles of activity can signal fragmentation – your team might be spread thin, or siloes might exist where knowledge isn't shared widely. Striking the right balance is key.
Dead Zones: Channels that haven't seen a message in months are essentially "dead zones." Some of these are normal (completed projects, old initiative chats). If a critical team channel has gone quiet, that's a red flag – maybe communication moved to DMs or stopped altogether. In contrast, if you have a channel meant for cross-team knowledge sharing and it's a ghost town, that's an opportunity to revive or officially archive it.
Message Volume: Slack's Overview gives you the total messages sent in the last 24 hours, 7 days, 30 days, etc., and you can track trends. A message spike or surge might correspond to a major project launch or crisis. If your team sent 50% more Slack messages this quarter, did output increase correspondingly? Or are people talking about work more than doing work?
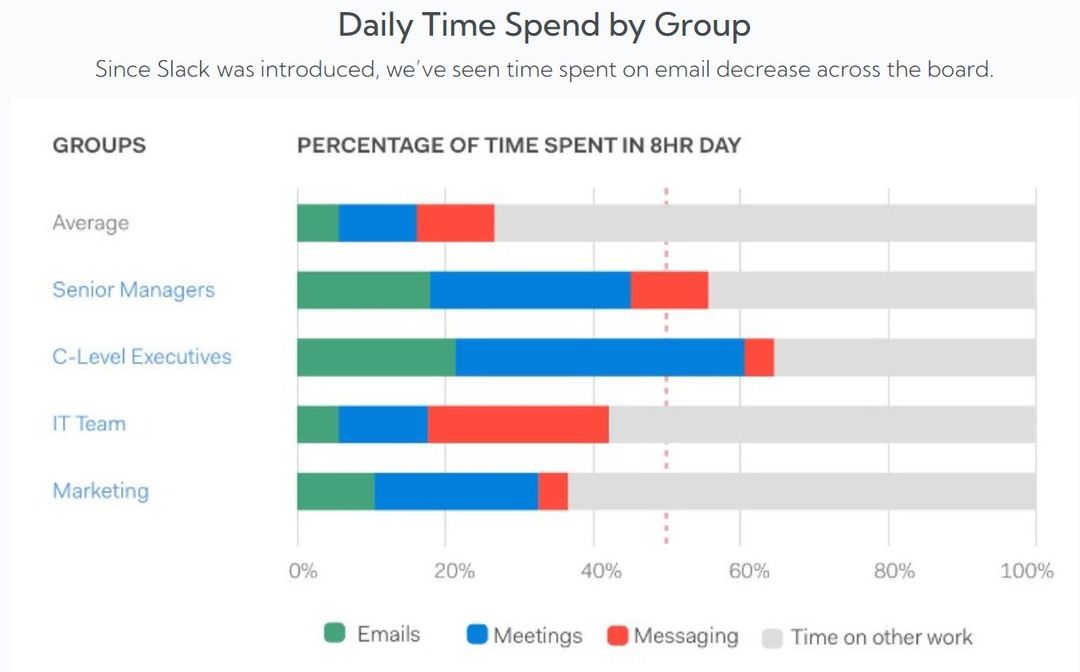
Collaboration Overload: Research shows that collaboration demands have exploded. Harvard Business Review notes that time spent on email, IM, calls, and meetings has risen over 50% in the past decade, now consuming 85% of most people's workweeks. During the transition to remote work, instant messaging traffic (e.g., Slack) jumped another 65%.
The goal is sustainable collaboration, enough communication to be effective but not so much that it becomes a constant distraction.
Slack's "Active Members" metric reveals how engaged your workforce is. If only 40 of 100 members are active weekly, it may signal underuse or misalignment with team workflows. On the flip side, near-total participation could indicate over-communication and burnout risk. Balance is key.
Often, a few people dominate Slack activity. If 3–5% of users drive most collaboration, they may face overload. Use Slack analytics to identify over-relied-upon individuals and redistribute responsibilities to prevent bottlenecks and burnout.
Slack's "Mentions" metric can flag under-engaged members or overloaded hubs. Encourage broader participation by rotating roles or prompting quieter voices. If one person answers all support questions, consider FAQs or training others. Use data to foster inclusivity, not to judge.
Slack alone doesn't reveal how communication impacts outcomes. By integrating Slack data with software that provide a deeper analysis and integrates to most of collaboration and communication tools, you gain organizational-wide insights that improves productivity and prevents burnout
Export Slack data via APIs into BI tools like Apache Superset to visualize trends (e.g., message volume, thread growth, channel activity). These dashboards enable trend analysis, segmentation, and alerting beyond Slack's built-in view.
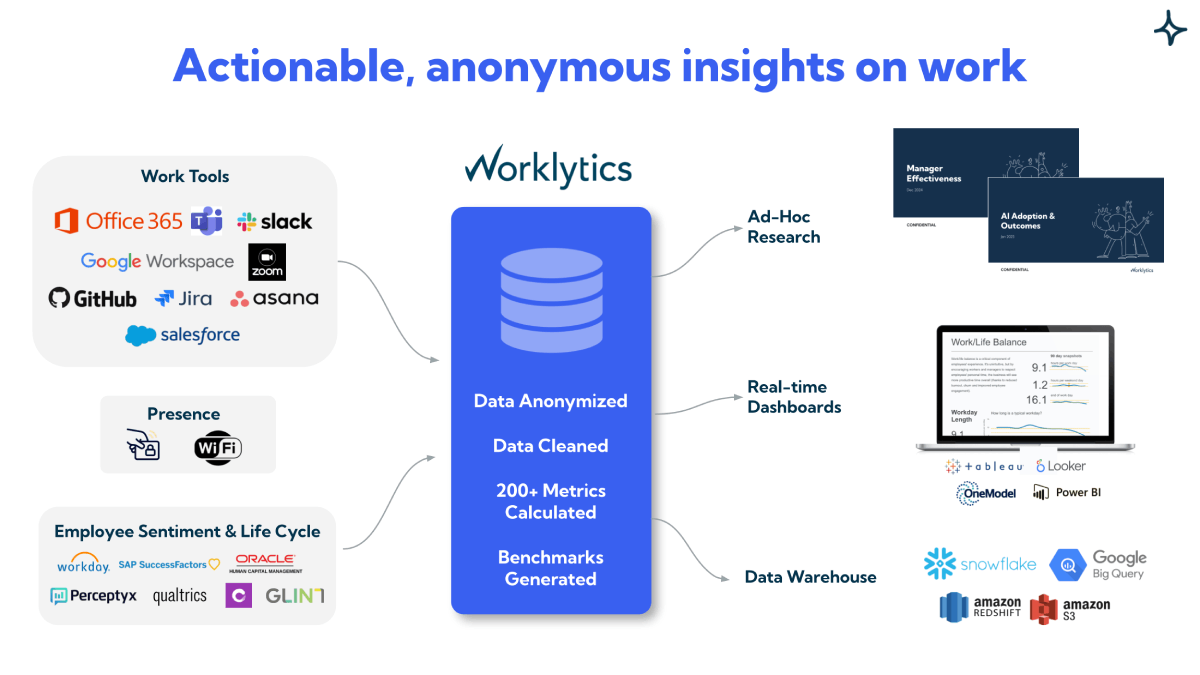
Tools like Worklytics and Peoplelogic offer pre-built integrations that combine Slack with other workplace data, delivering comprehensive dashboards and insights without coding.
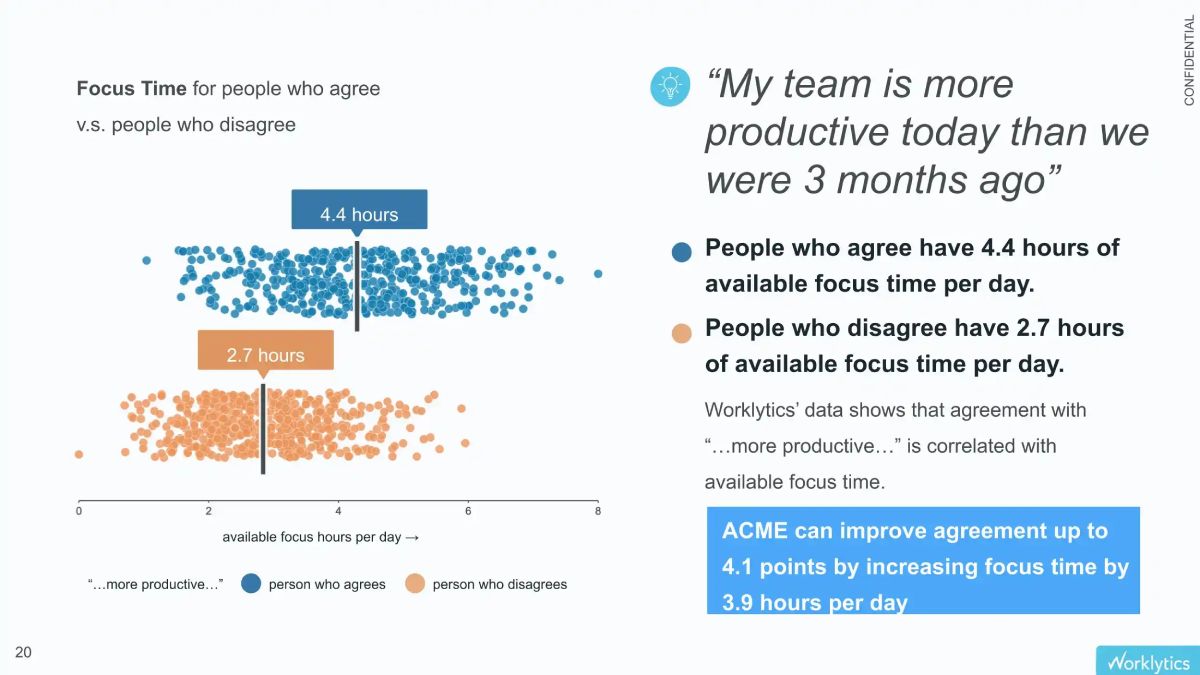
Powerful insights emerge when you link Slack data with outcomes—like Jira completions or focus time. Worklytics, for instance, can highlight how Slack chatter affects deep work or show whether multitasking on Slack correlates with lower productivity.
One company found that 75% of messages were in DMs or private channels. They shifted to "public-by-default" communications, resulting in a 40% increase in #engineering messages and improved transparency and onboarding.
Another team discovered two members handling most Slack questions. Management redistributed the workload and added "Slack office hours." Participation became more balanced, bottlenecks eased, and burnout risk was reduced.
While Slack provides basic usage data, Worklytics transforms that raw activity into a strategic map of organizational health. It moves beyond "who is posting" to "how work is getting done."
Worklytics doesn't just count messages; it correlates Slack activity with productivity drivers like Focus Time and Meeting Load.
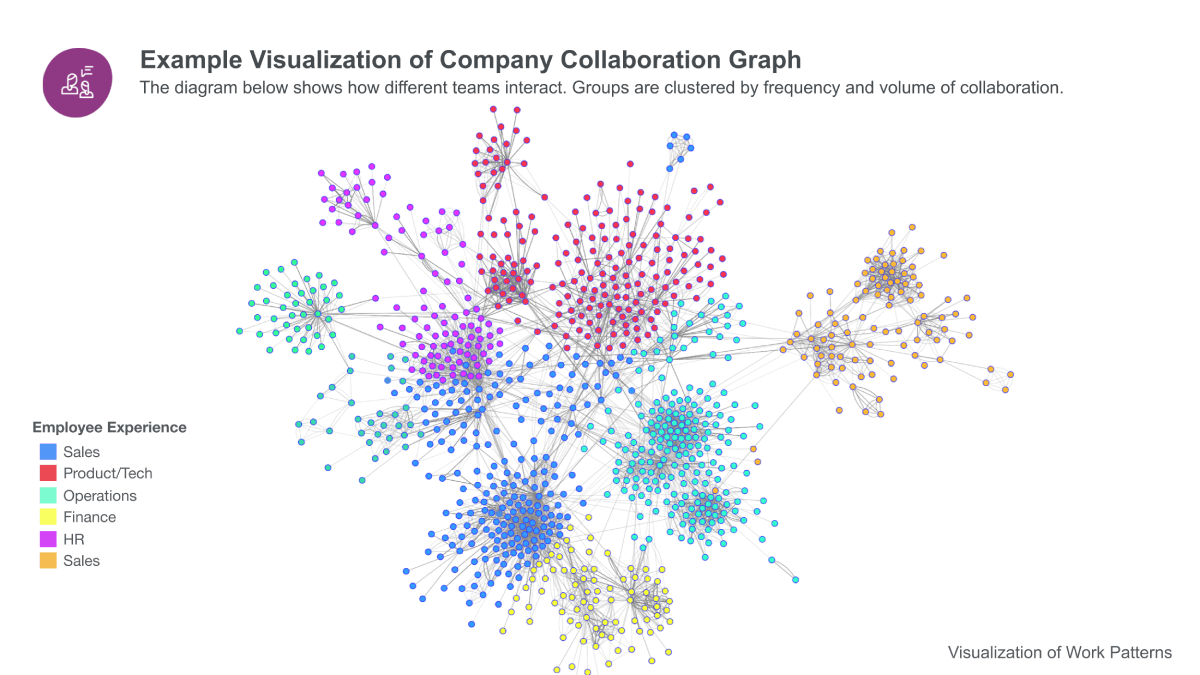
Using Organizational Network Analysis (ONA), Worklytics visualizes the informal social graph of your company.
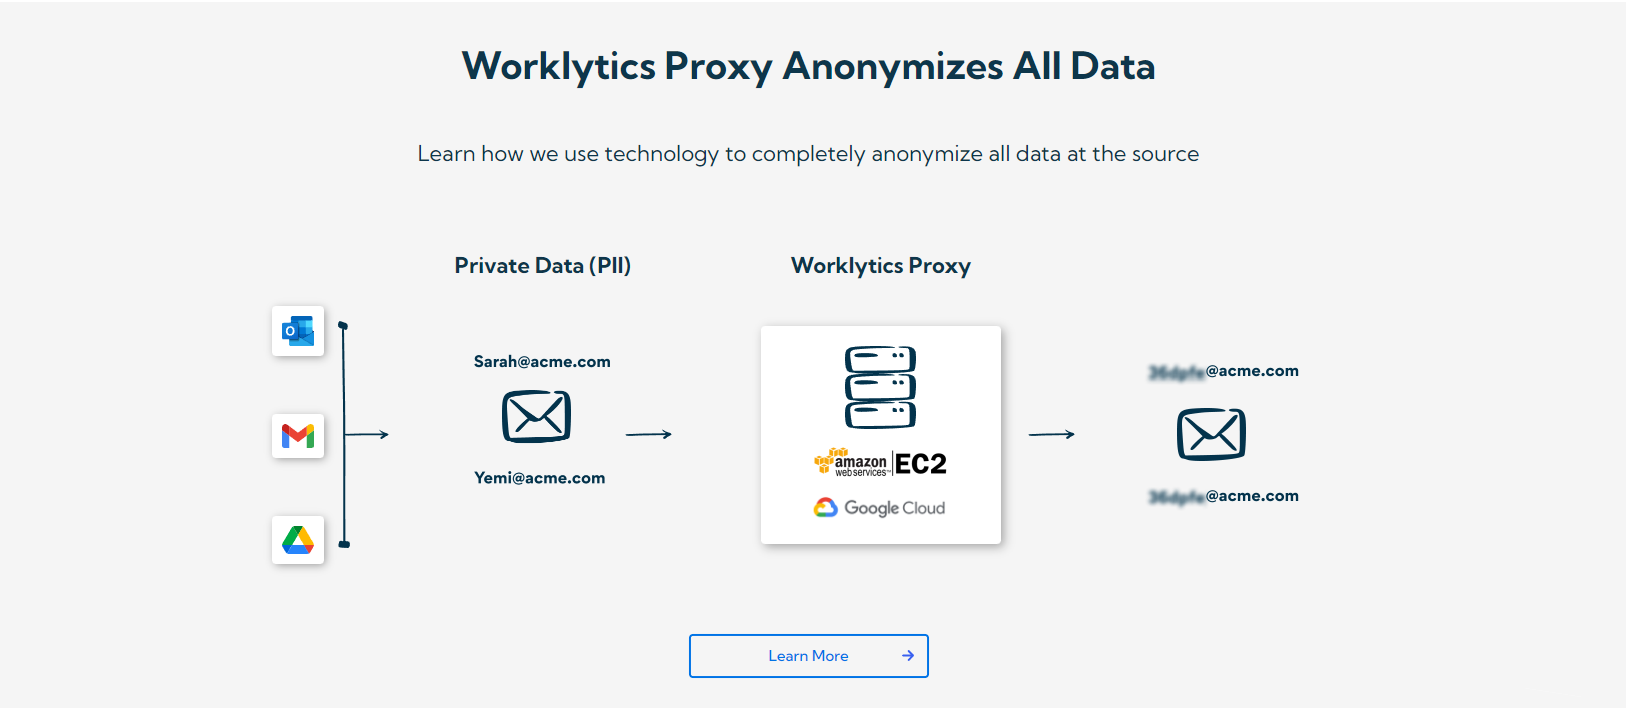
Worklytics is built on the principle of Data Minimization. It provides deep insights without ever compromising employee trust.
Slack data is most powerful when it isn't viewed in a vacuum. Worklytics aggregates data from your entire tech stack—including Jira, GitHub, Zoom, and Google Calendar.
The platform moves from Diagnostic (what happened) to Prescriptive (what to do).
Slack analytics can transform collaboration when used thoughtfully. Rather than just counting messages, focus on what those messages mean. Use data to identify silos, overload, or under-engagement—and address them constructively. When combined with tools like Worklytics, Slack becomes more than a messaging app; it's a strategic signal of how your organization operates. The key is closing the loop: analyze, act, and track results. In doing so, you turn communication patterns into a blueprint for a healthier, more effective workplace.


