
Organizational network analysis (ONA) tools map how people actually work together: who talks to whom, how information flows, and where it gets stuck. That helps leaders find hidden influencers, break down silos, and manage change with real data instead of guesswork.
The best tool for you comes down to one question: do you want active surveys, passive data, or both?
We based each tool profile on each vendor’s official product pages and documentation, reviewed in September 2026, and grouped the tools by how they collect data. Where a detail comes from a vendor, we describe what the product does rather than repeat marketing statistics we could not verify. Every source is linked at the end of this guide.
ONA studies the real relationships inside a company: who collaborates, who people go to for help, and how information moves between teams.
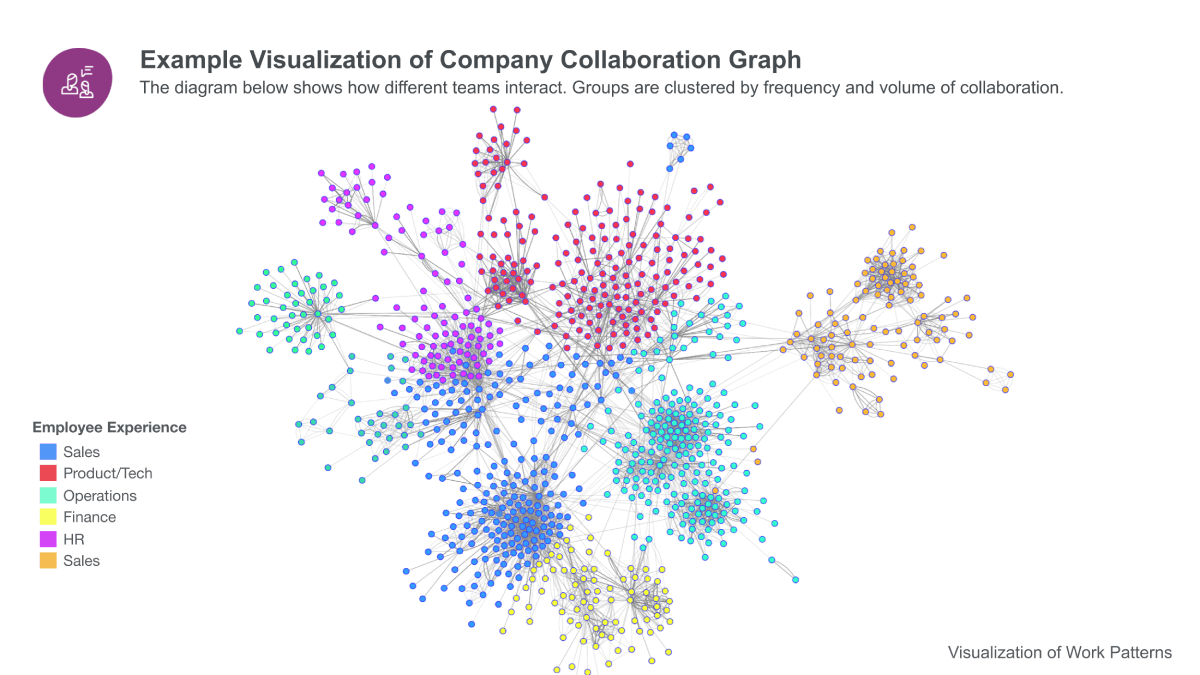
An org chart shows the formal reporting structure. ONA reveals the informal network, the people and connections that actually get work done. The field was shaped by researchers such as Rob Cross, whose work on collaboration and network analysis is widely cited.
Two quick clarifications, because the category is often confused:
You may also see the term social network analysis (SNA). SNA is the broader academic method for studying any network of relationships. ONA is SNA applied to organizations.
Before comparing tools, decide how you want to collect the data. This single choice narrows the field faster than any feature list.
Active (survey-based) ONA asks employees who they collaborate with and rely on. Surveys capture perception and context, the reasons behind a connection, and they can ask about relationships that leave no digital trace. The tradeoffs: surveys add to employees’ workloads, response rates fall if you run them often, and each survey only captures a single moment in time, so the picture ages quickly as the organization changes.
Passive ONA reads the metadata your collaboration tools already produce, such as who emails, messages, or meets with whom. It reads the pattern, not the content. It runs continuously, so the picture stays current, and there is no survey fatigue. The tradeoff is that passive data shows behavior, not motivation, so it infers the reasons rather than asking directly. Strong passive tools protect privacy by anonymizing data and reporting only aggregated patterns.
Many platforms now offer both. The right mix depends on whether you value continuous, low-effort measurement (passive) or richer perception data you are willing to collect through surveys (active).
Whatever you choose, judge tools on the same criteria:
We grouped the twelve tools by the active-versus-passive choice, since that is where most buyers start.
Automatic analysis from the digital signals your tools already create.
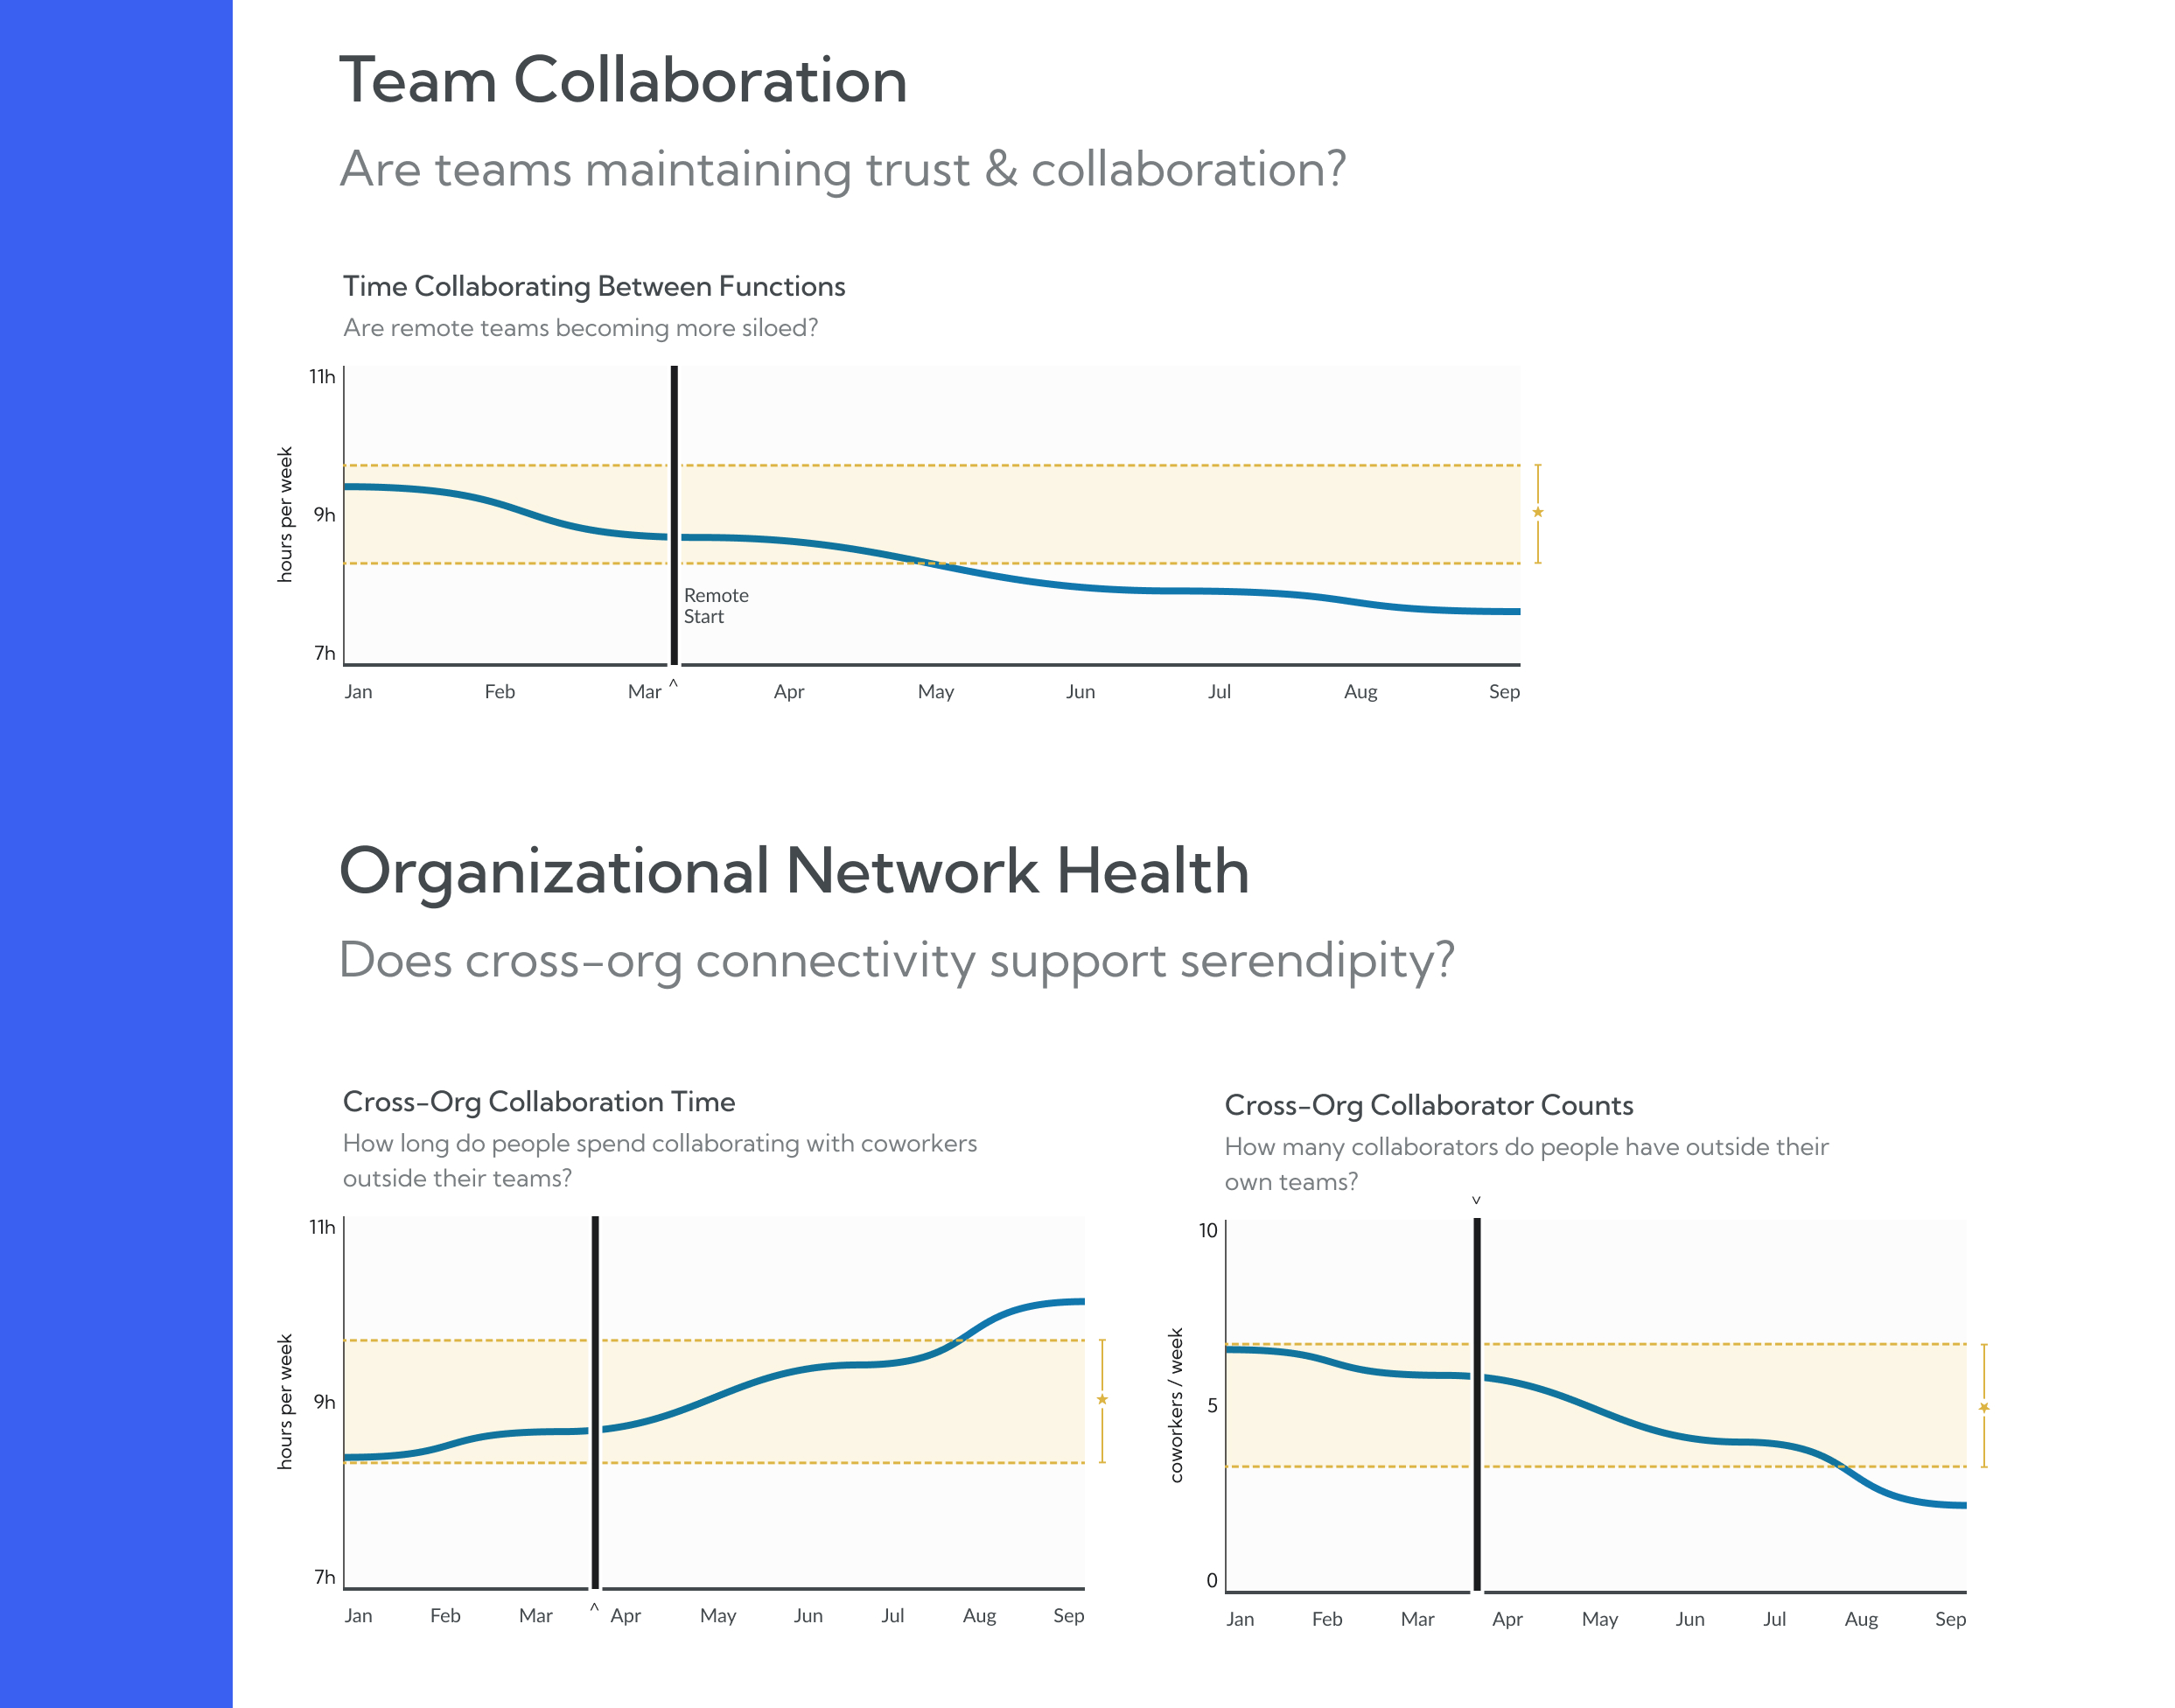
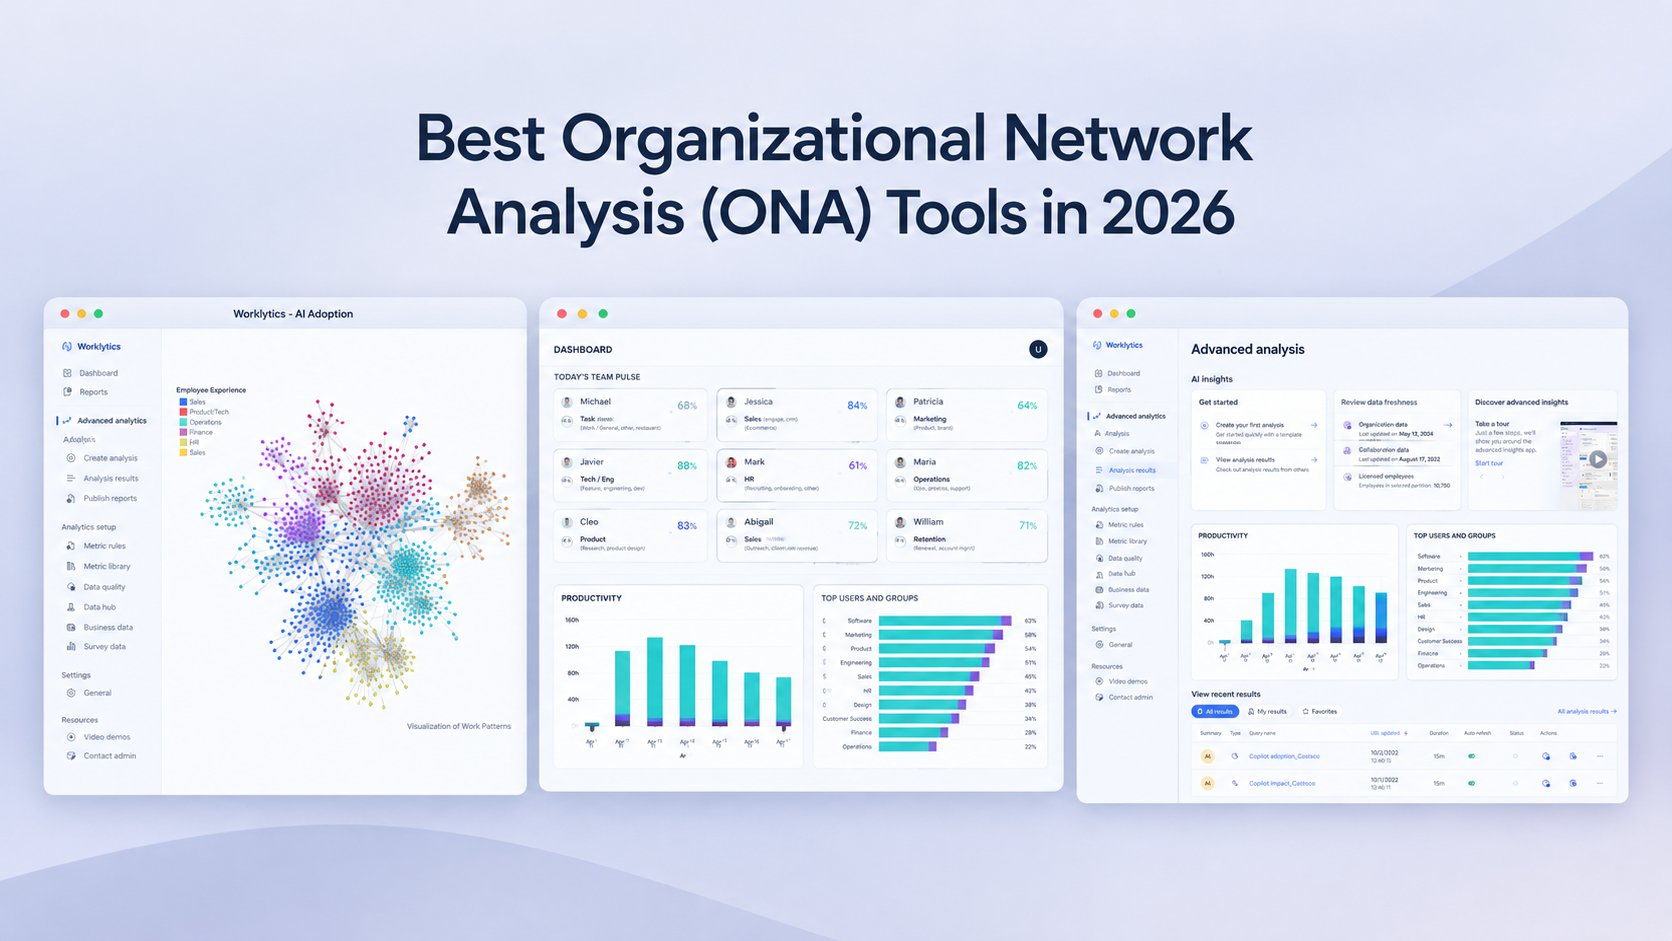
Worklytics is a passive, privacy-first ONA platform. It connects to more than 25 tools, including Microsoft 365, Google Workspace, Slack, Teams, Zoom, Salesforce, GitHub, and Jira, and turns the metadata into collaboration maps and network metrics such as in-degree, out-degree, eigenvector and betweenness centrality, network density, and collaboration volume. Data is anonymized or pseudonymized at the source, and results are reported as aggregated patterns, so you get network insight without monitoring individuals. Worklytics also measures adoption of AI tools across vendors (Claude, ChatGPT, Microsoft Copilot, and Gemini) alongside collaboration. That is broader than the Microsoft-only Copilot analytics in Viva Insights and tyGraph, and the survey-based tools do not track AI adoption at all.
Best for: enterprises on Microsoft 365 or Google Workspace that want continuous, privacy-first ONA, with connections to most collaboration tools and AI agents.
Not for: teams that specifically want perception or sentiment surveys, since Worklytics is passive by design.
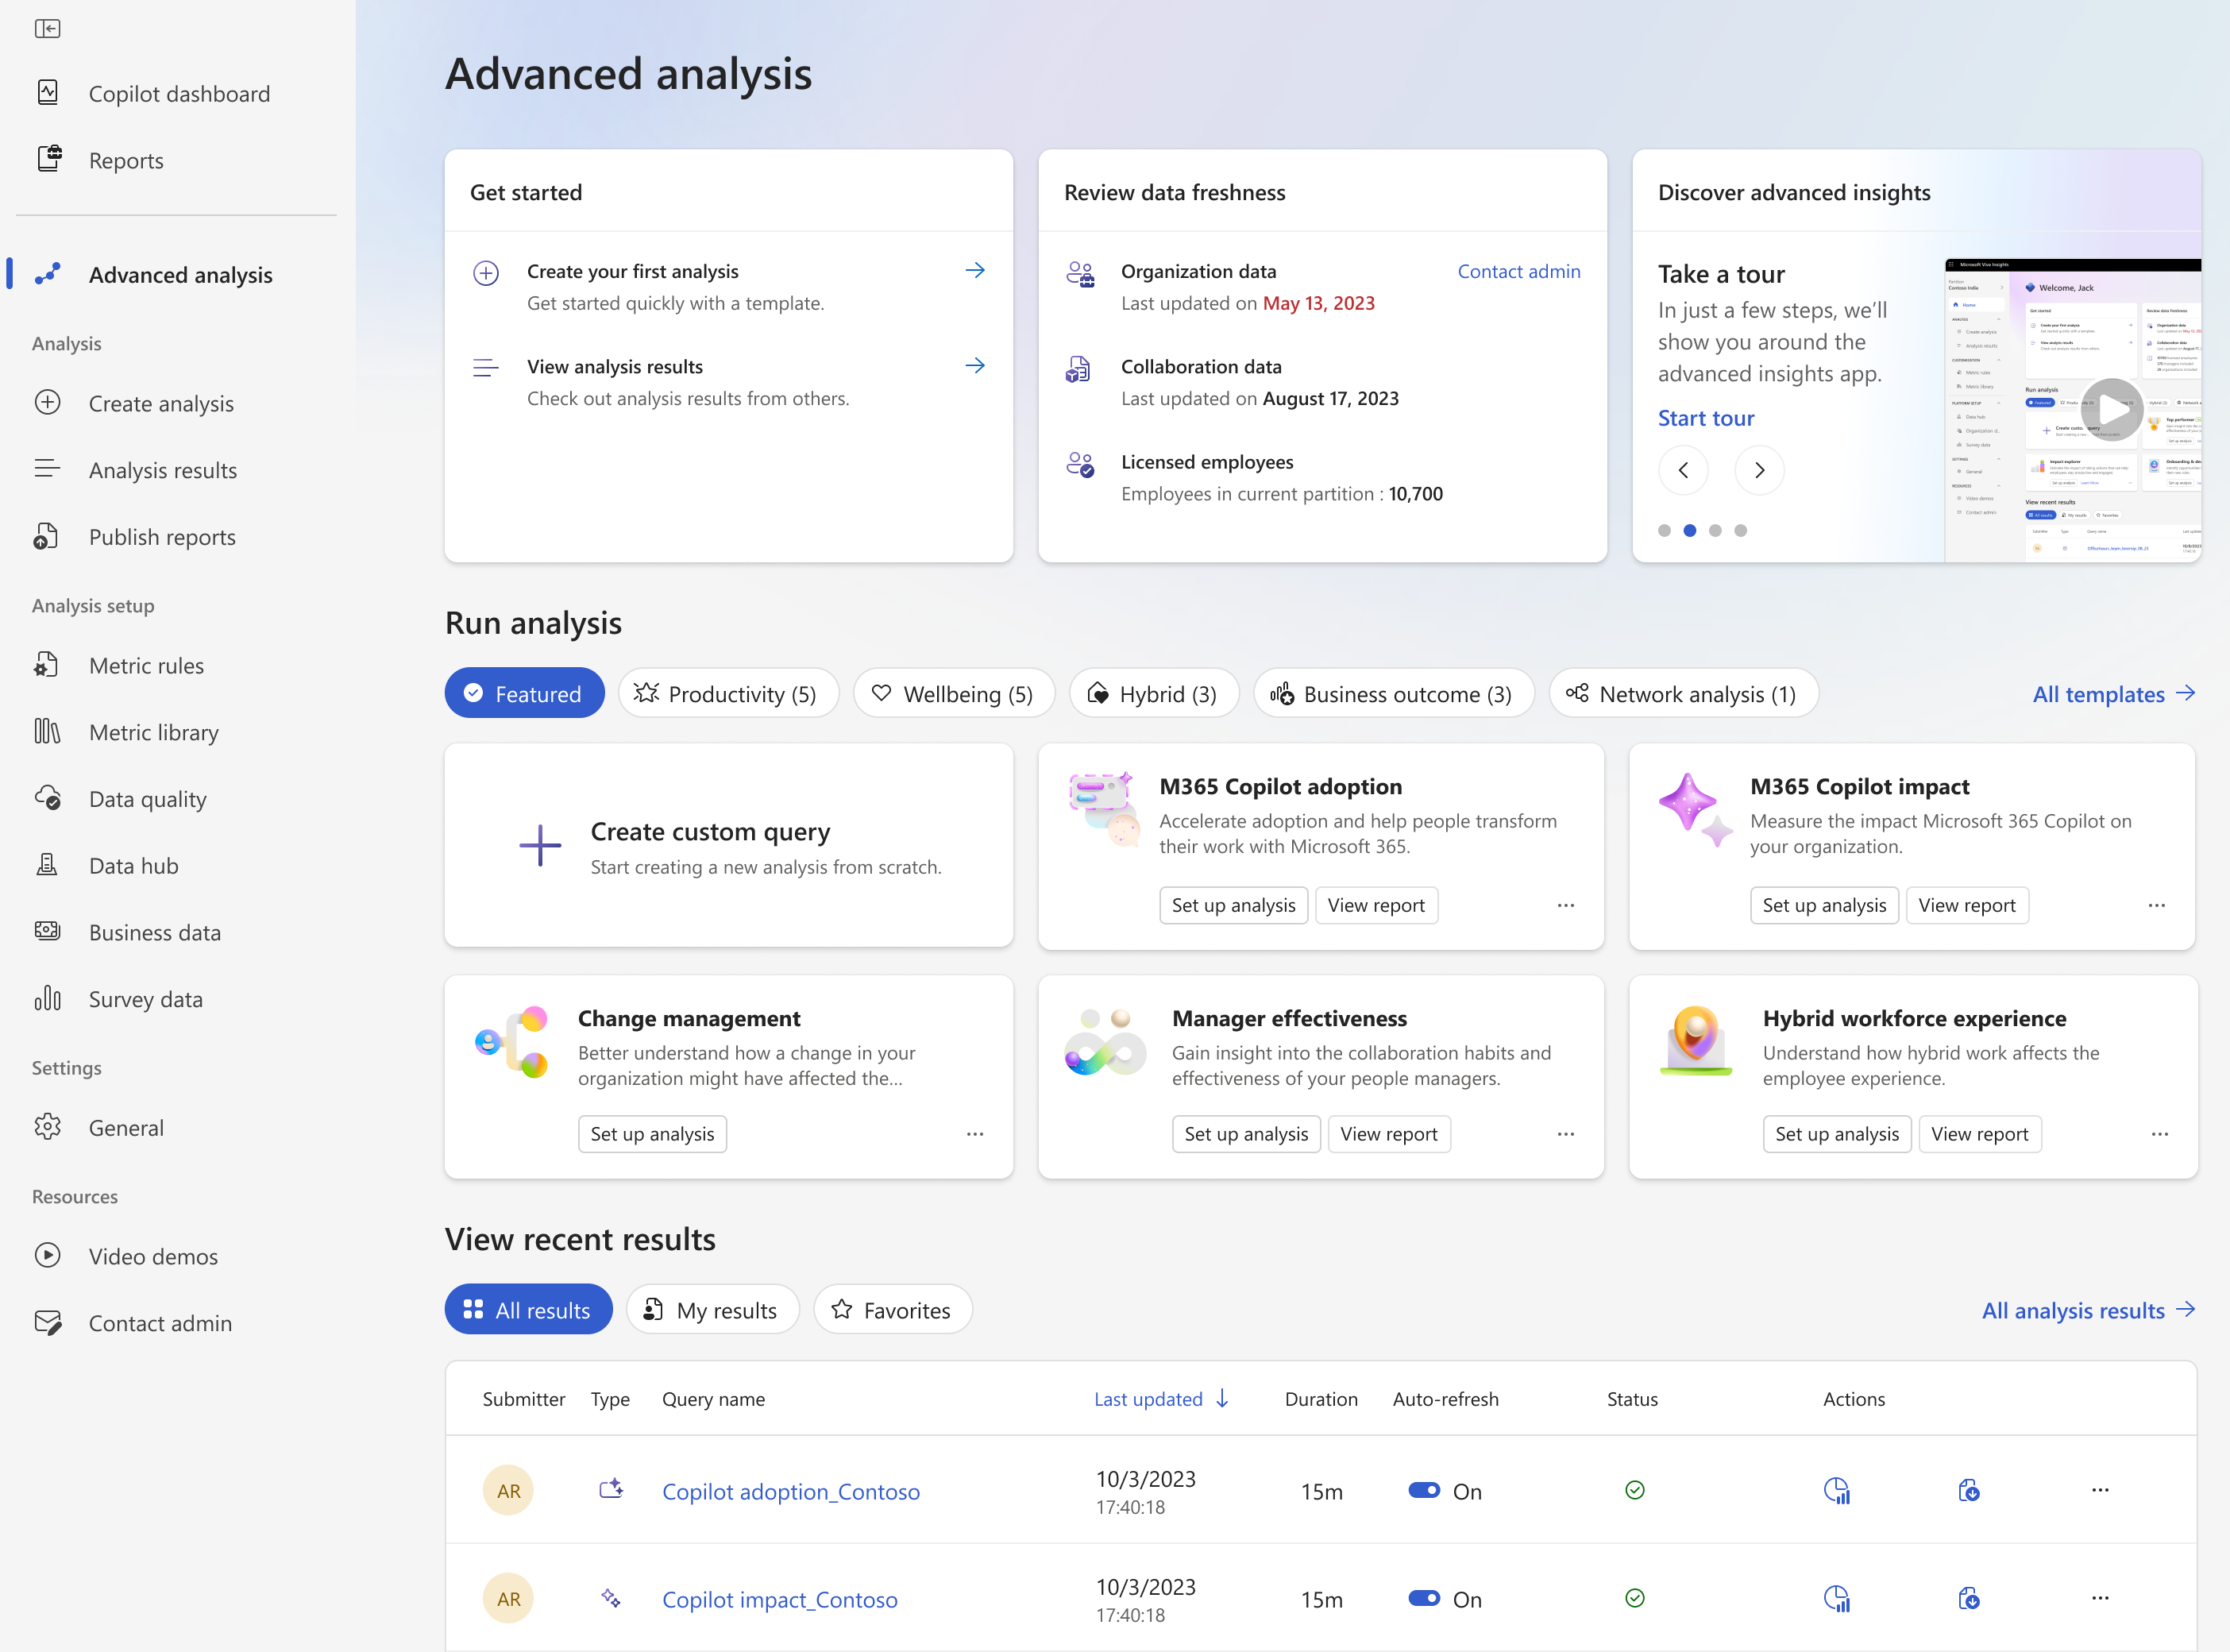
Viva Insights is Microsoft’s own analytics layer for Microsoft 365. Its advanced analysis tools let analysts run organizational network analysis queries on Microsoft 365 collaboration signals, and Copilot in Viva can help build those queries. It also includes detailed Copilot adoption analytics and benchmarks.
Best for: organizations already committed to Microsoft 365 and Viva that want native analytics with no extra vendor.
Not for: companies on Google Workspace, Slack, or a mix of tools, since Viva only sees Microsoft 365. Advanced features also require a threshold of Viva or Copilot licenses.
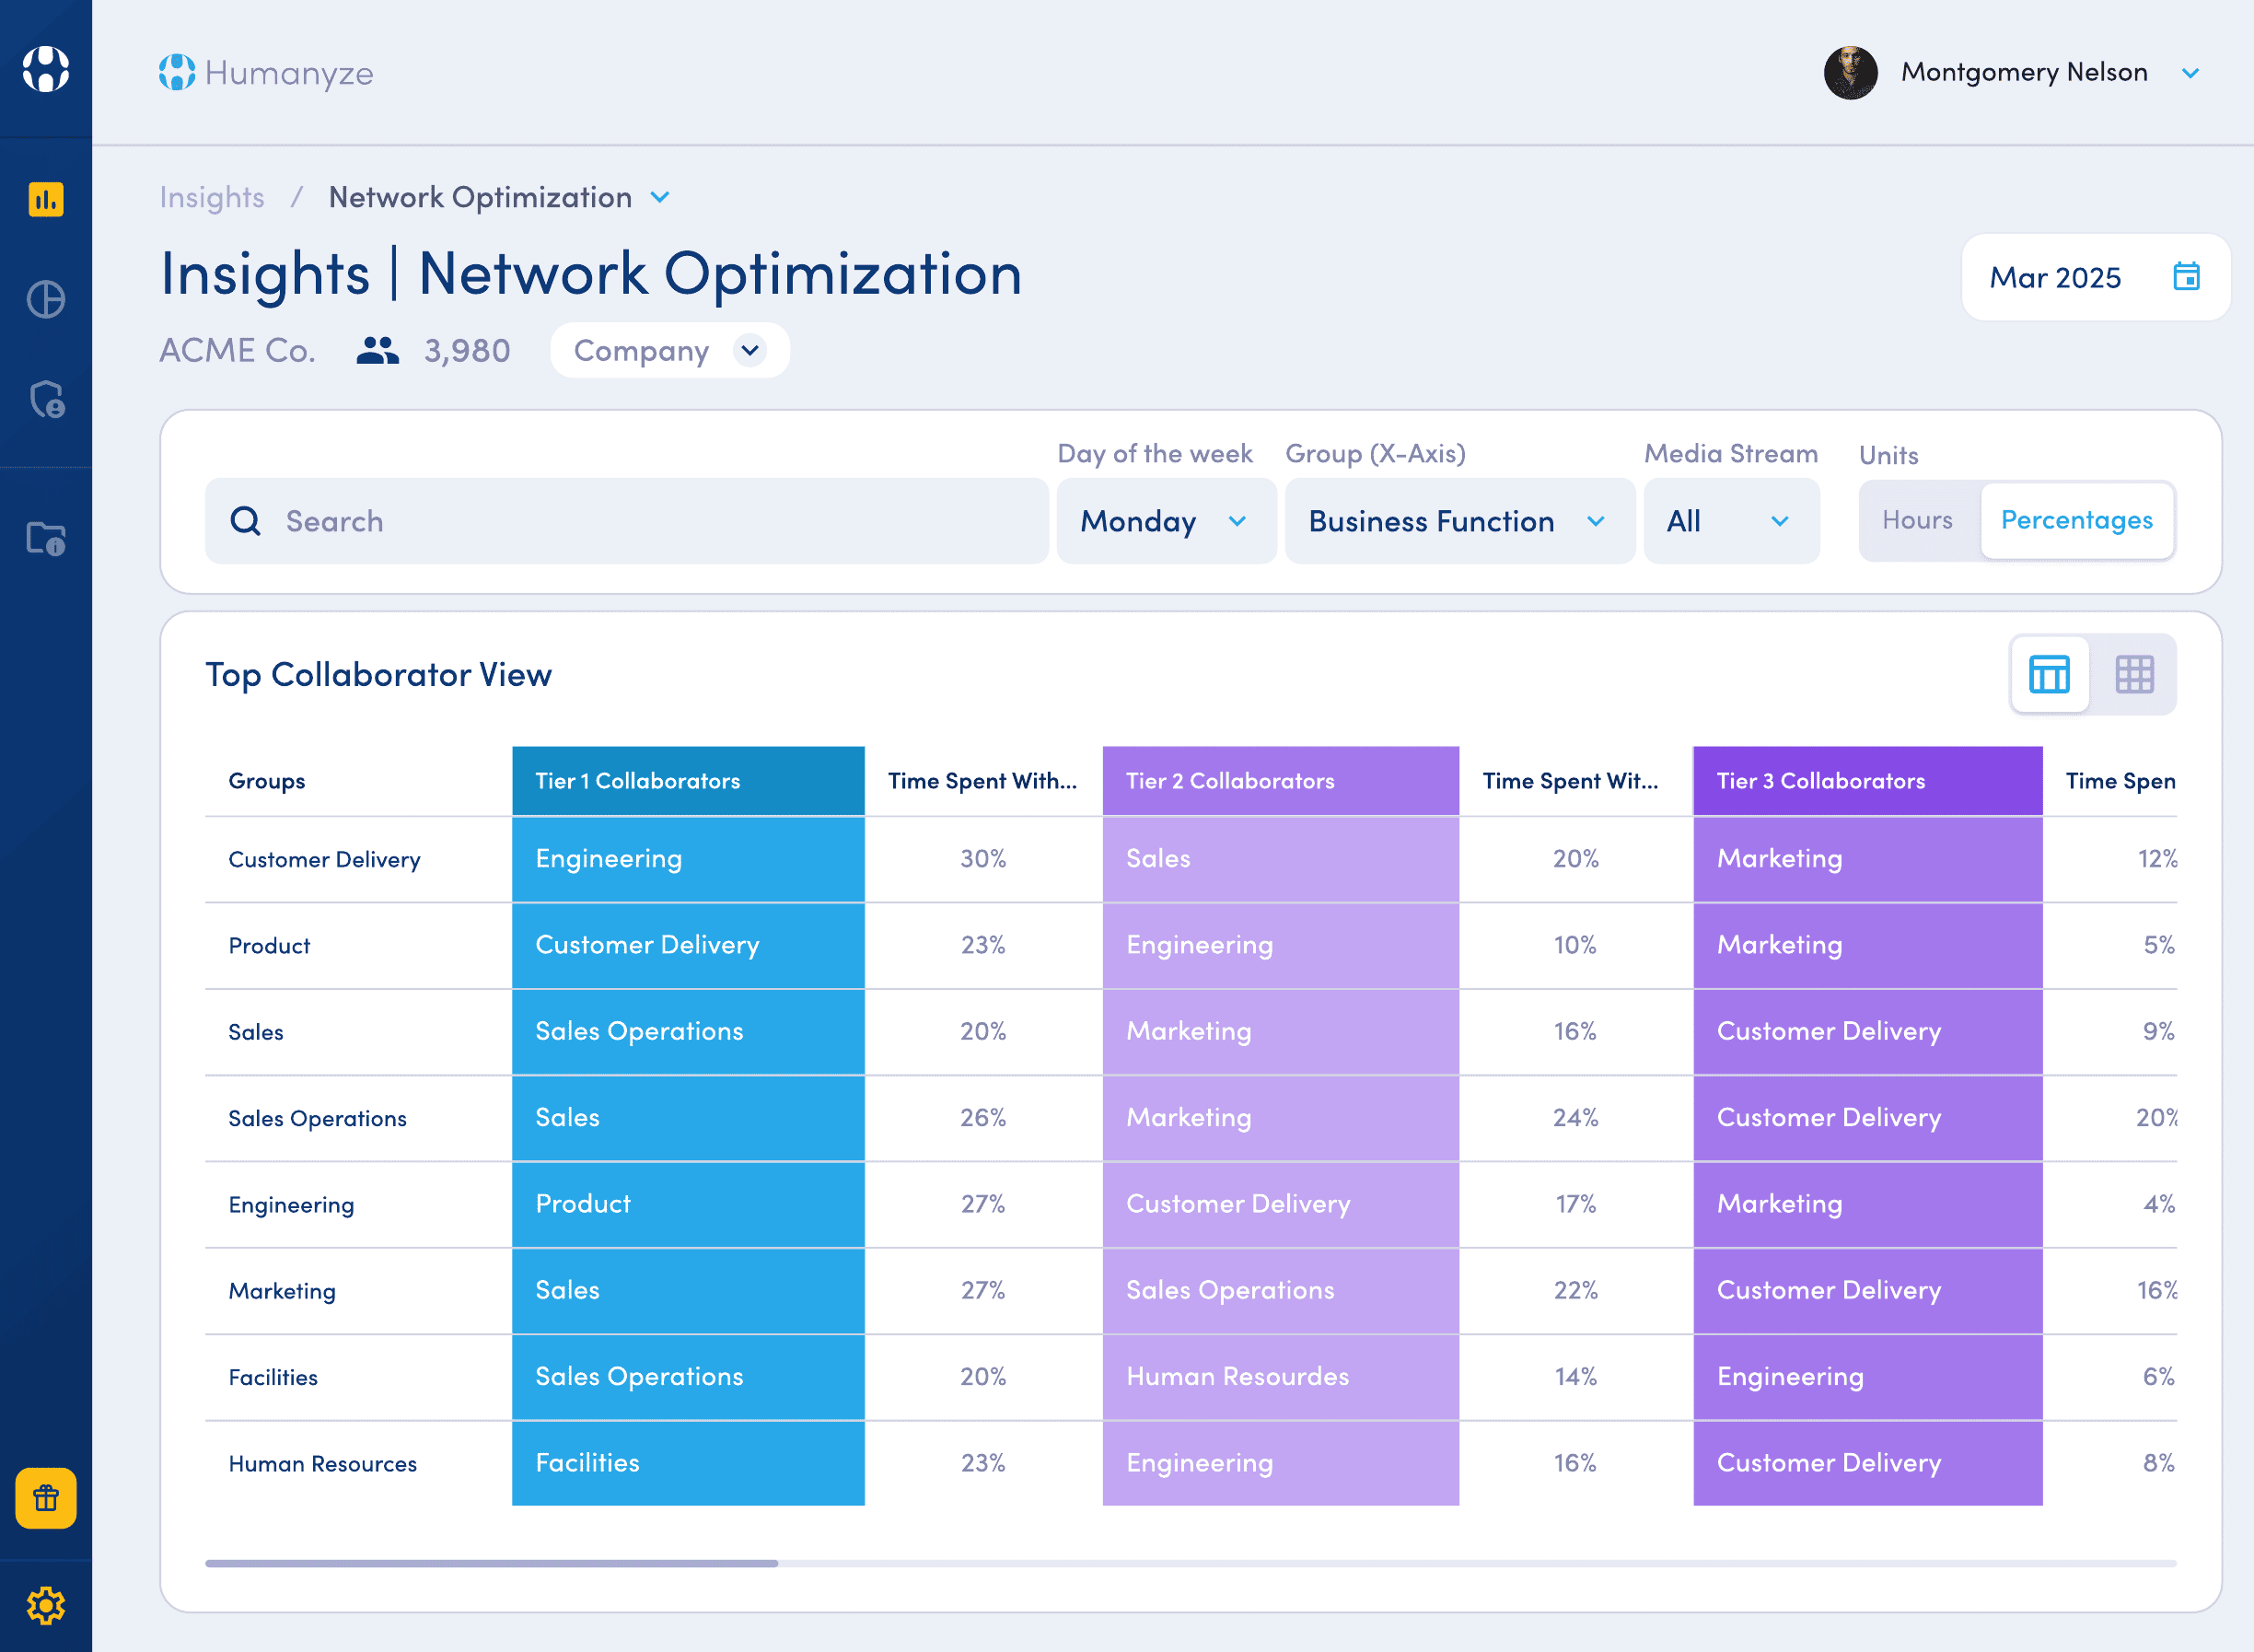
Humanyze is a workforce analytics platform built around its Organizational Health Score, which groups metrics into engagement, productivity, and adaptability. It analyzes anonymized metadata from more than 20 tools (and, historically, optional office sensors), never content, keystrokes, or screens, and is designed around GDPR-style privacy.
Best for: large enterprises that want a single health score plus advisory support.
Not for: smaller teams that want a self-serve tool rather than a consulting-led engagement.
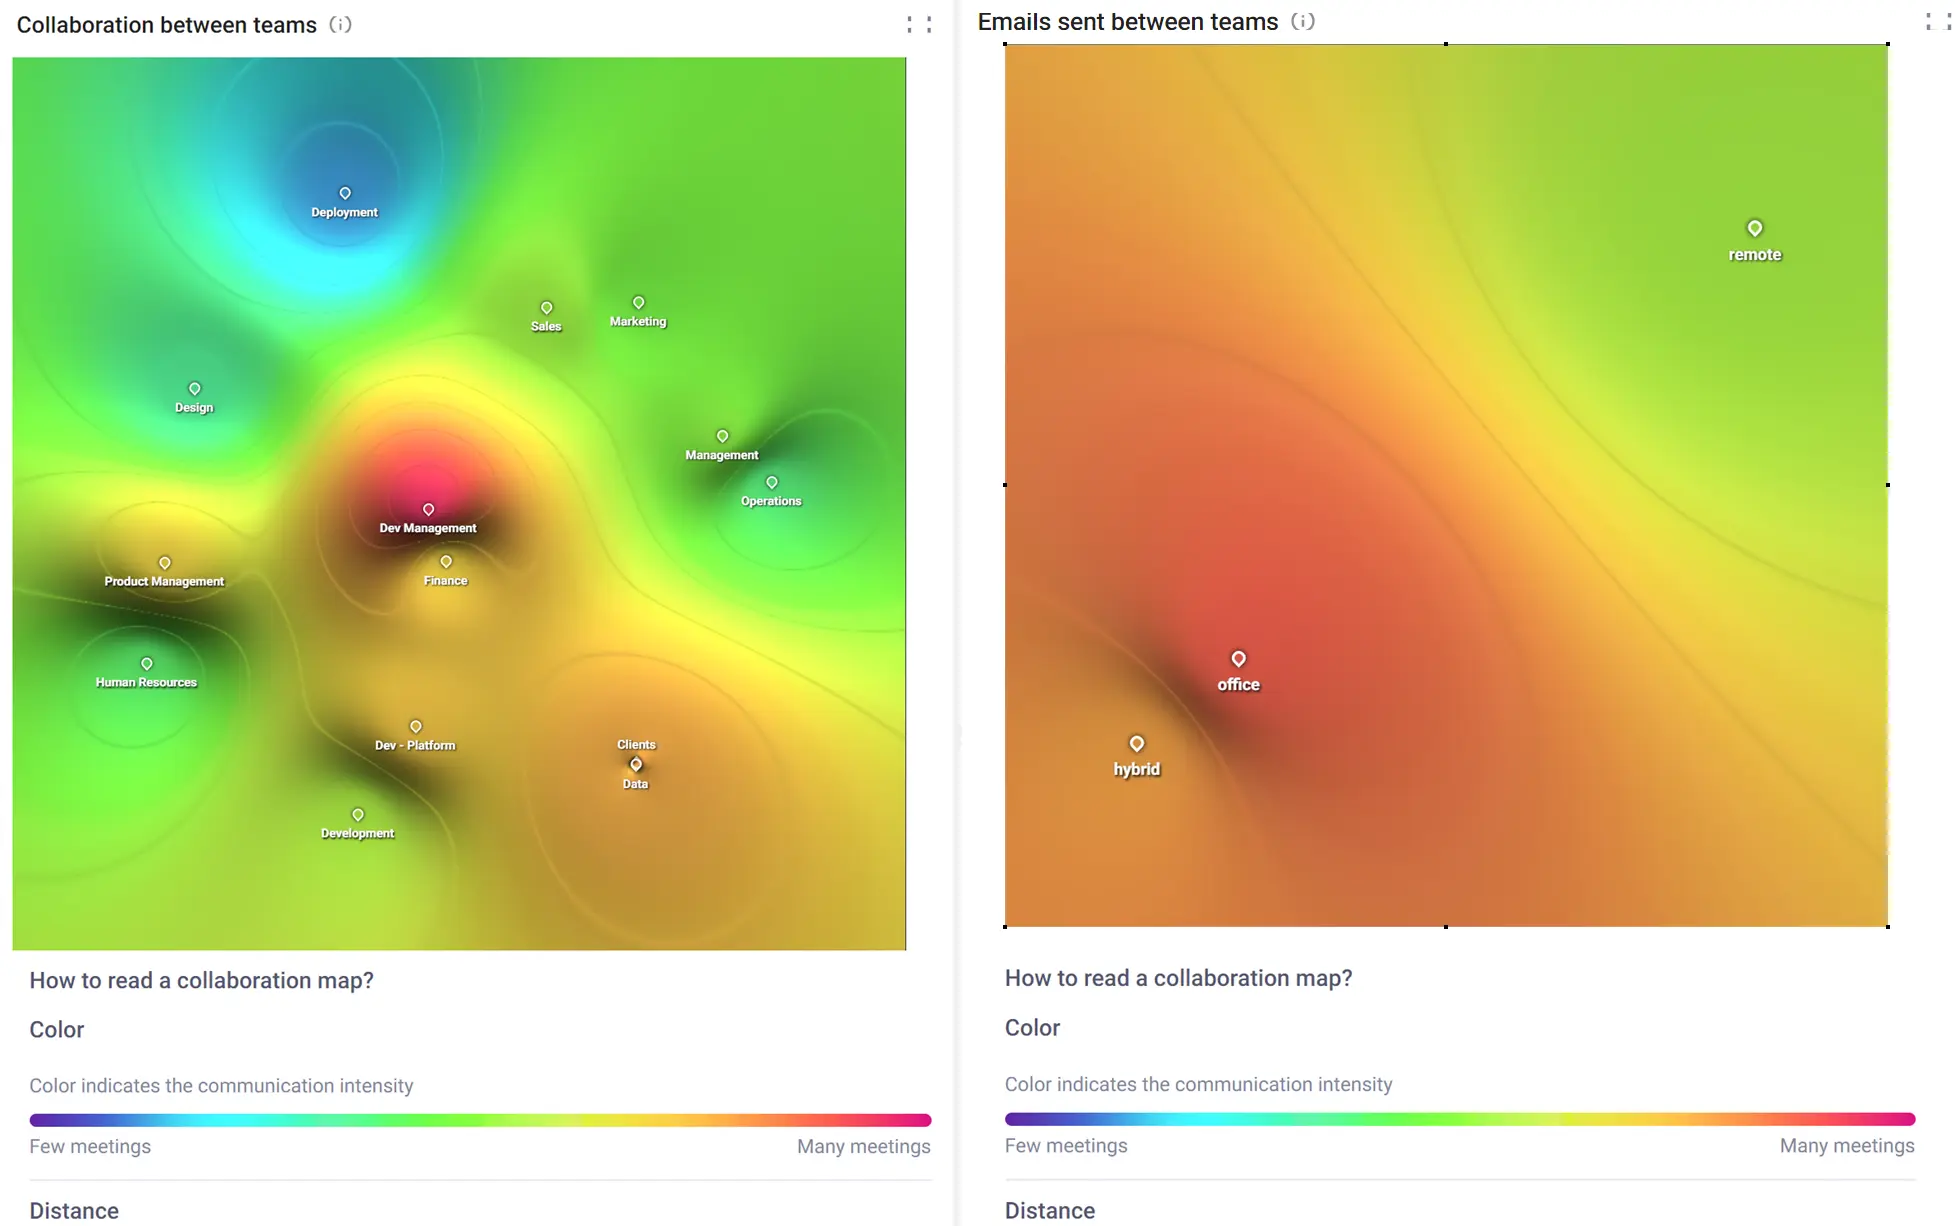
Time is Ltd. is a collaboration and productivity analytics platform, sometimes described as Google Analytics for productivity. It offers more than 200 metrics across meetings, messaging, email, and focus time for both Microsoft 365 and Google Workspace, plus network metrics and a data platform and API that pipe clean data into tools like BigQuery and Tableau.
Best for: teams focused on meeting and collaboration optimization that want to blend the data into their own reporting.
Not for: buyers who want deep, dedicated network analysis as the main event rather than collaboration metrics.
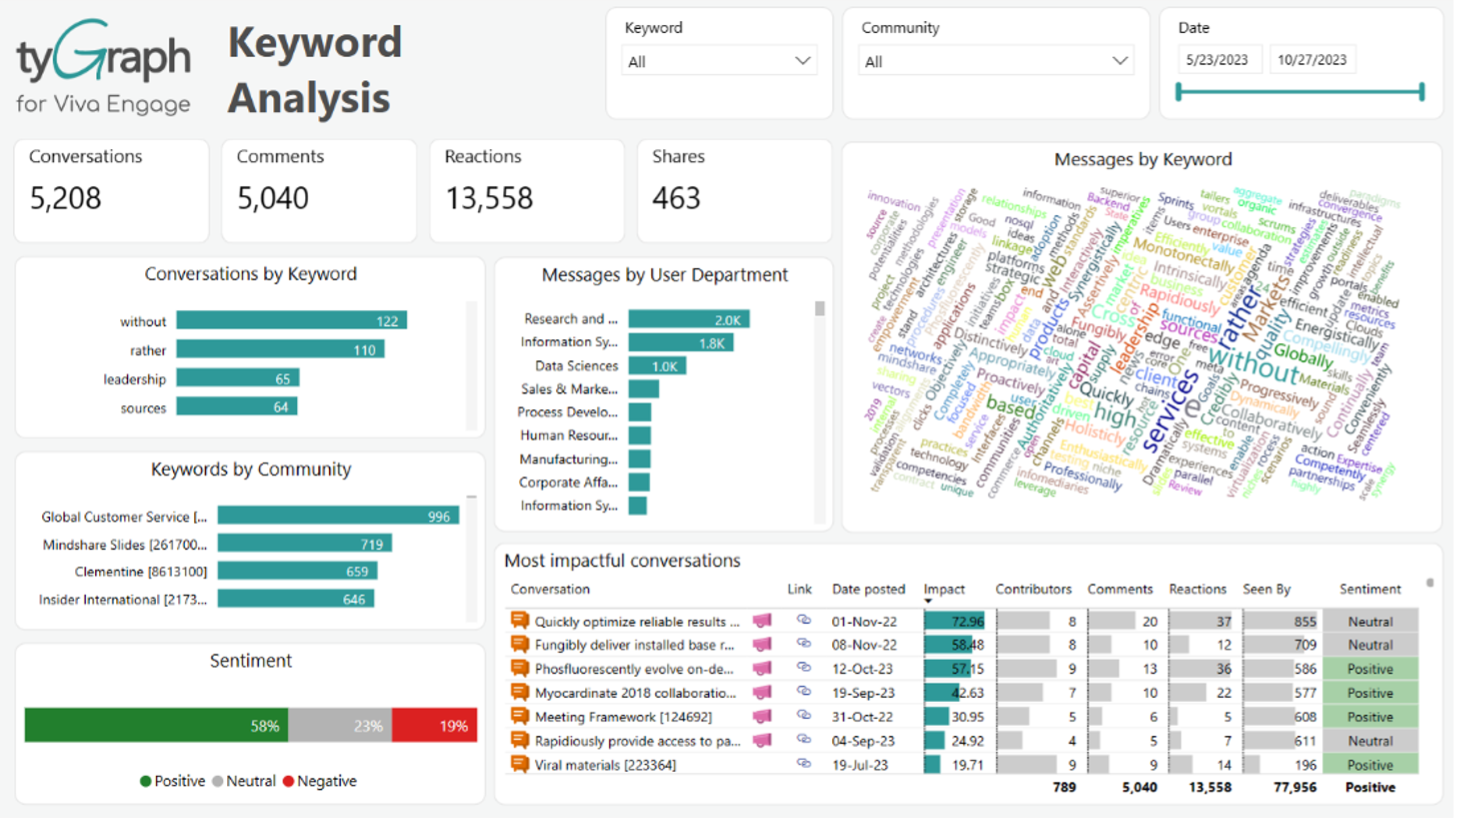
AvePoint tyGraph is a Microsoft 365 analytics product covering SharePoint, Teams, and OneDrive, with sentiment, keyword, and topic analysis, Copilot analytics, and reporting through Power BI. It keeps up to one to two years of history, well beyond the native 90-day window.
Best for: Microsoft 365 admins who want adoption plus content and collaboration analytics.
Not for: teams that need true network and centrality metrics, which is not tyGraph’s focus.
Active surveys, often combined with passive data.
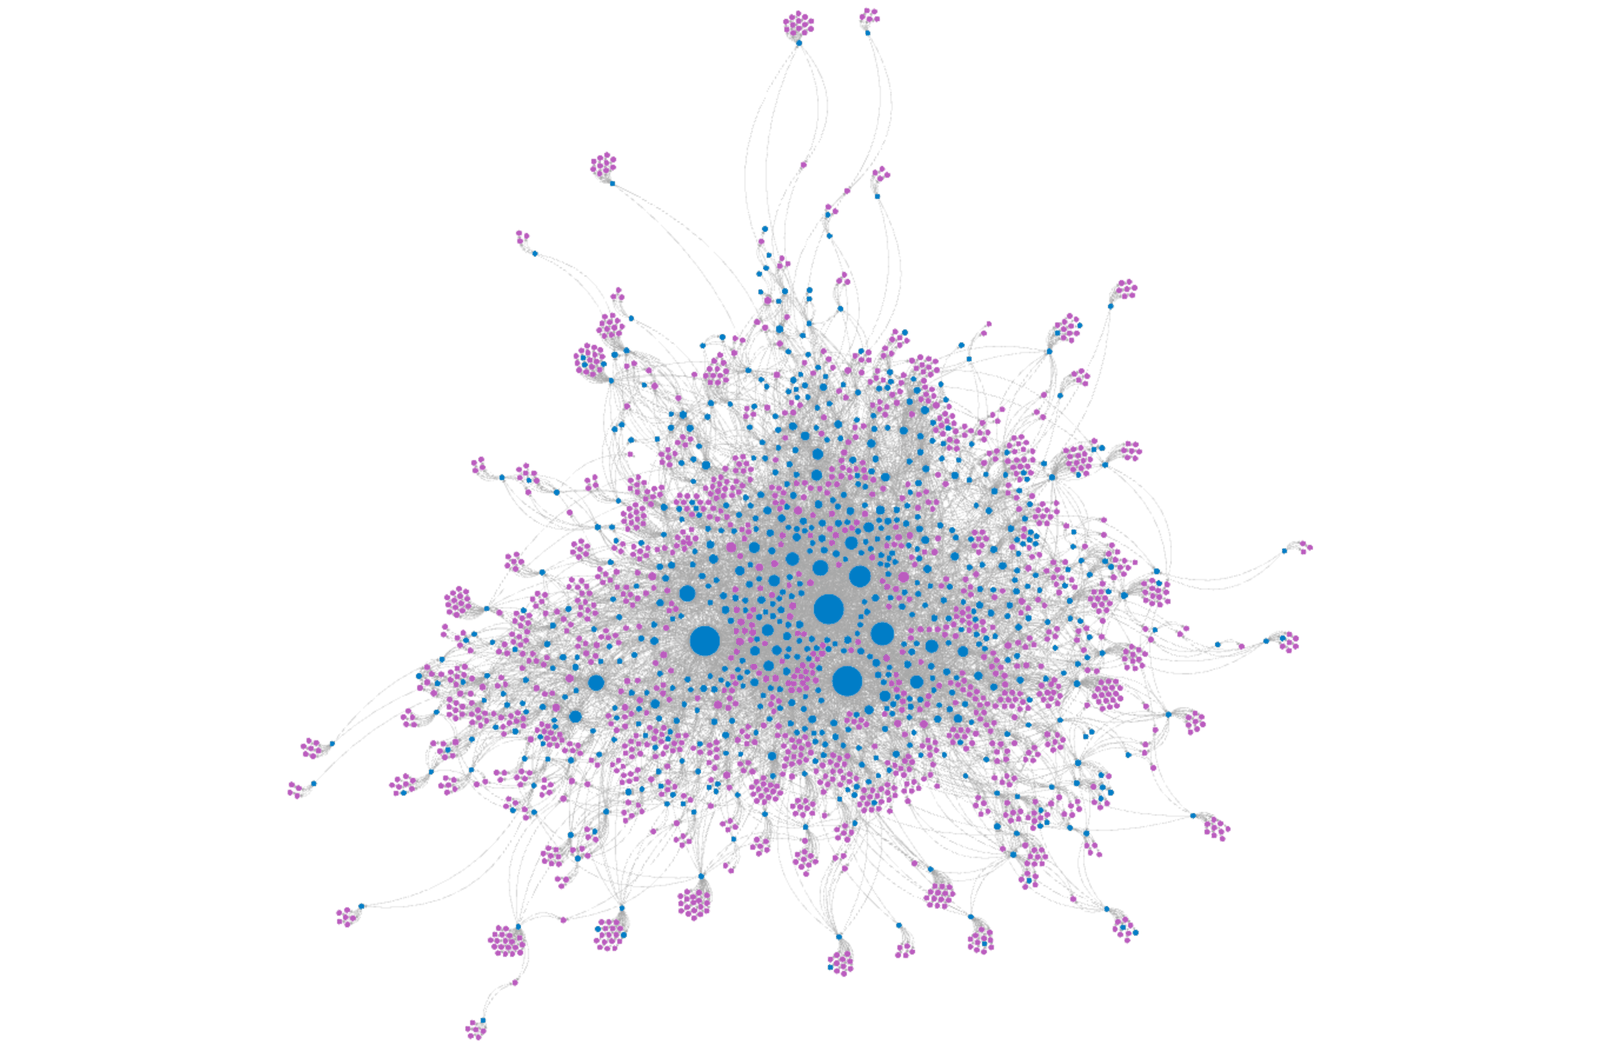
Polinode is a flexible ONA platform that supports both custom relationship surveys and passive integrations (Microsoft 365, Google Workspace, Teams, Slack). It offers more than 30 metrics, an AI chat for querying your network, and visualization that scales to tens of thousands of nodes.
Best for: analysts and consultants who want active and passive ONA together with powerful, customizable visualization.
Not for: buyers who want a hands-off, fully passive tool, since much of Polinode’s value is in configuring surveys and views.
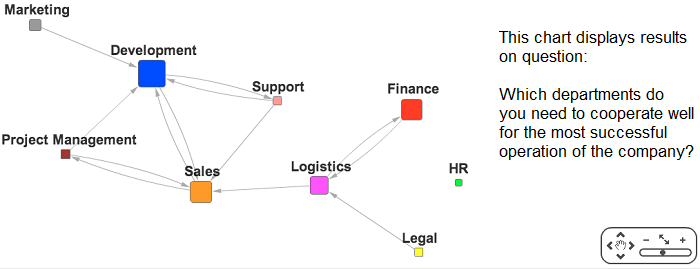
OrgMapper, now branded Kondct, combines active surveys and passive data with a strong change-management focus. It offers real-time network monitoring, predictive analytics, benchmarking drawn from projects across more than 76 countries, and certification training.
Best for: change-management and organizational-development programs that want benchmarked, survey-driven ONA.
Not for: teams wanting a continuous, product-only tool rather than a project or consulting engagement.
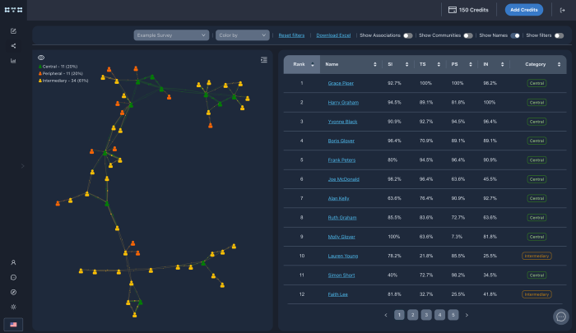
Cognitive Network Analyzer, from Cognitive Talent Solutions, is an AI-powered ONA platform that uses both active and passive data. Its distinctive feature is embedded AI agents that turn insights into action, connecting the right people, triggering tailored communications, and tracking outcomes over time. It integrates with ServiceNow.
Best for: talent and organizational-development teams that want ONA that also acts on the findings.
Not for: buyers who only need measurement and visualization without the automation layer.
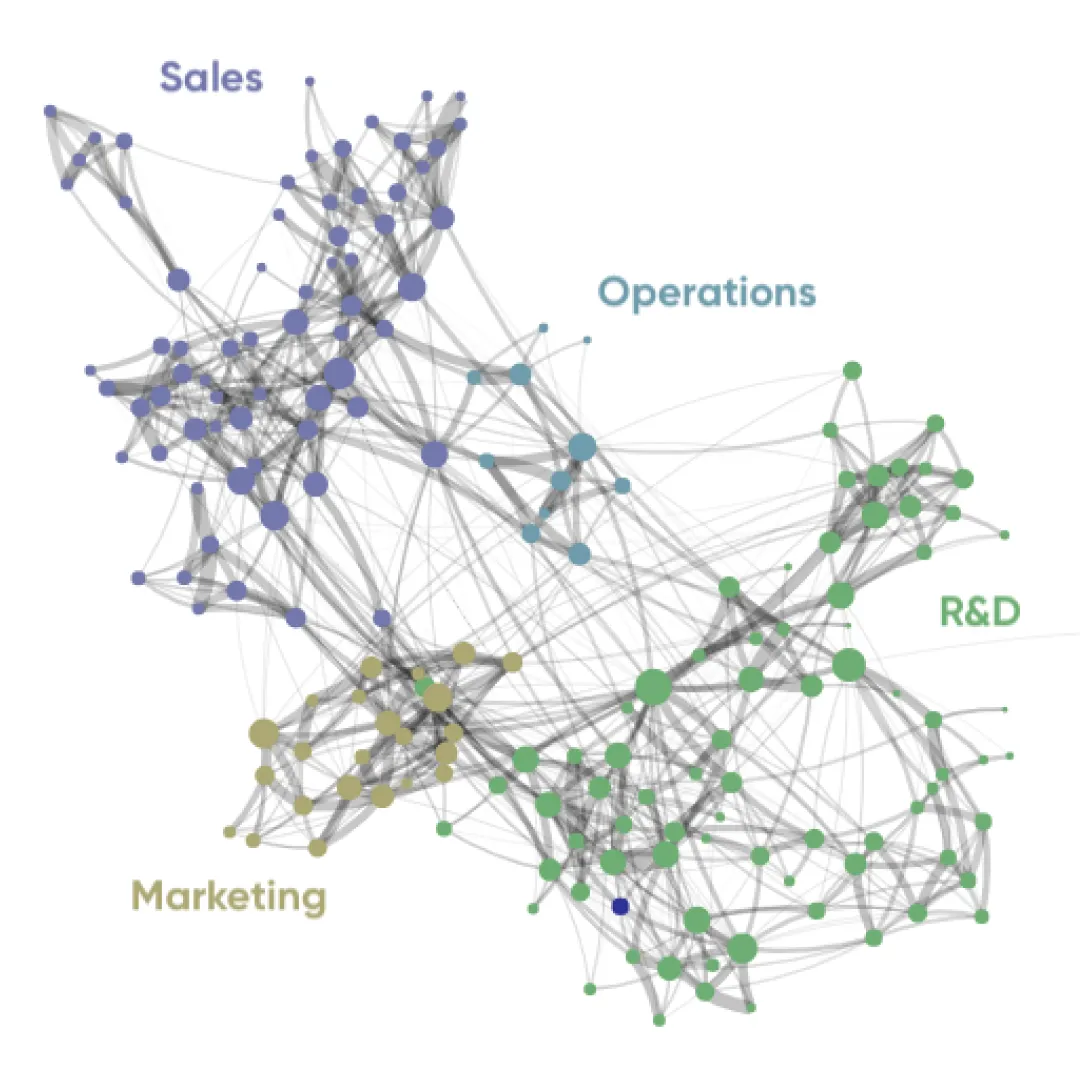
Teamspective is a feedback-led platform that runs inside Slack and Microsoft Teams. Alongside pulse surveys, 360 feedback, and performance reviews, it offers ONA that overlays engagement and wellbeing data on the collaboration map.
Best for: mid-market and high-growth teams that want engagement, feedback, and light ONA in one place.
Not for: enterprises that need deep, dedicated network analysis, since ONA is one feature among several here.
For analysts and researchers who want to explore the data themselves.
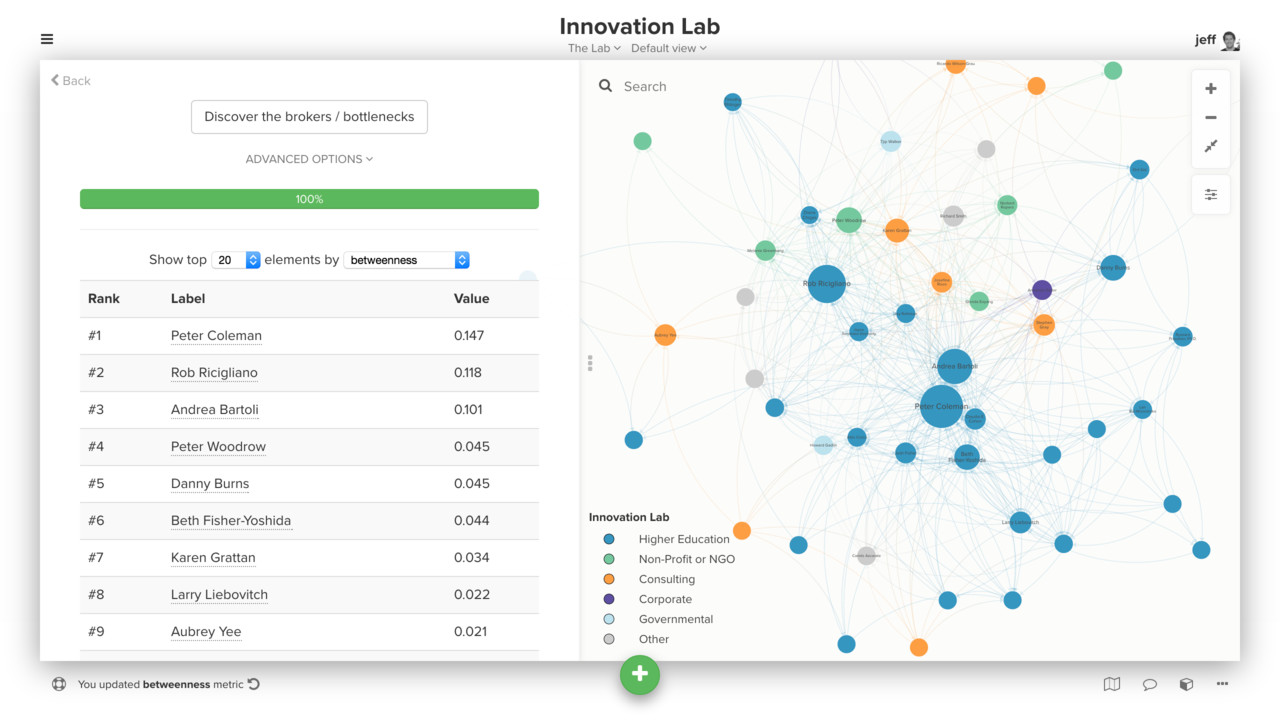
Kumu is a flexible, low-cost mapping tool for relationships and systems. You import data from spreadsheets or Google Sheets and build network maps with centrality metrics, community detection, and rich styling.
Best for: consultants and researchers who want hands-on, affordable mapping for any kind of network.
Not for: teams that need automatic data collection, since Kumu maps whatever data you give it.
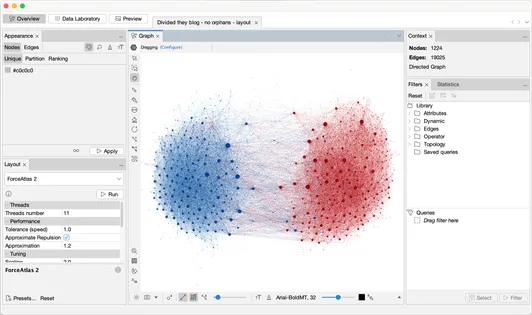
Gephi is a free, open-source desktop tool for visualizing and exploring networks. You import node and edge tables and use its layout algorithms, metrics, and community detection to study a network in depth.
Best for: analysts and researchers doing one-off, in-depth network visualization at no cost.
Not for: organizations that want an ongoing, managed platform with data collection and privacy built in.
UCINET is a long-standing academic toolkit for social network analysis, usually paired with NetDraw for visualization. It offers deep statistical measures but is a research tool, not an enterprise product.
Best for: academics and analysts who need rigorous SNA methods.
Not for: business teams that want an operational, integrated platform.
A note on the listings: some roundups list Neo4j and Cytoscape as ONA tools. They are powerful graph databases and graph-visualization tools, but they are general-purpose, not ONA products. And Microsoft Viva Glint, though excellent for engagement surveys, measures sentiment rather than collaboration networks. We left all three off the main list for that reason.
Every company’s collaboration network works differently, so what you prioritize decides which ONA tool fits. Here’s how our top picks line up:
What is an organizational network analysis tool?
An ONA tool maps the real relationships inside a company, who works with whom and how information flows, so leaders can find informal influencers, spot silos, and make better decisions about collaboration and change.
Is ONA the same as social network analysis (SNA)?
SNA is the broader academic method for studying any network of relationships. ONA is SNA applied to organizations, focused on how work and collaboration flow between people and teams.
Should I choose active or passive ONA?
Active (survey-based) ONA captures perception and reasons but adds employee effort and ages quickly. Passive ONA reads collaboration metadata continuously with no survey fatigue but infers the reasons. Many tools offer both.
Is ONA private and legal?
It can be, when done responsibly. Privacy-first tools analyze only metadata (not message content), anonymize or pseudonymize data, report aggregated patterns, and follow rules like GDPR. Always check a vendor’s privacy approach.
Do I need to run surveys to do ONA?
No. Passive tools such as Worklytics, Microsoft Viva Insights, Humanyze, and Time is Ltd. build the network from existing collaboration signals, so no surveys are required.
What is the best free ONA tool?
For free, open-source analysis, Gephi is the most popular choice, with UCINET common in academia. Kumu offers a flexible freemium option for building maps by hand.
How is ONA different from an org chart?
An org chart shows the official reporting structure. ONA shows the informal network, the connections people actually use to get work done, which often looks very different from the chart.
If you want continuous, privacy-first ONA across Microsoft 365, Google Workspace, and Slack, plus a clear view of how your teams are adopting AI, see how Worklytics measures collaboration without surveys. You can also explore MeasureAI to track AI adoption alongside your collaboration network.



