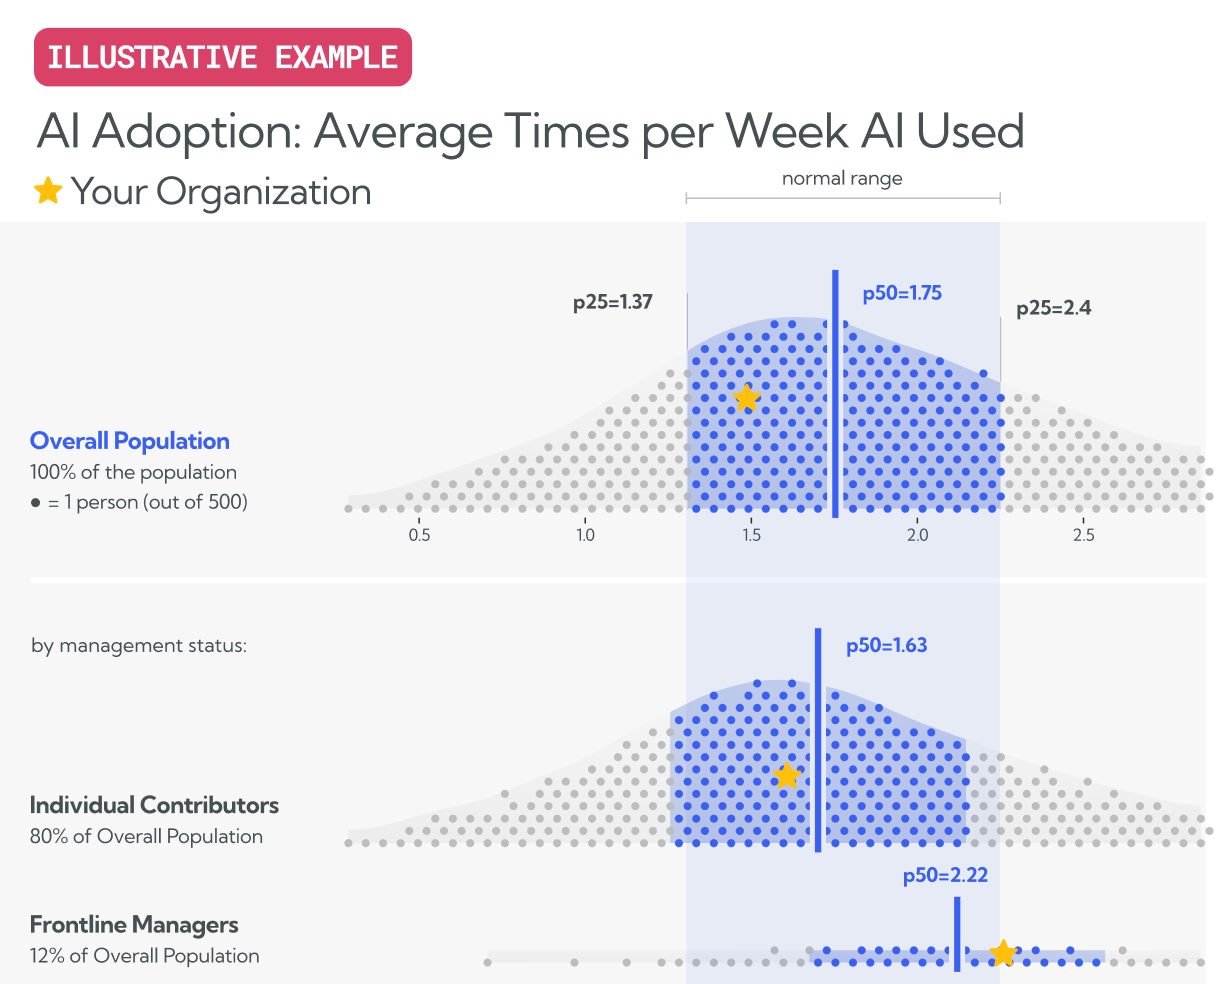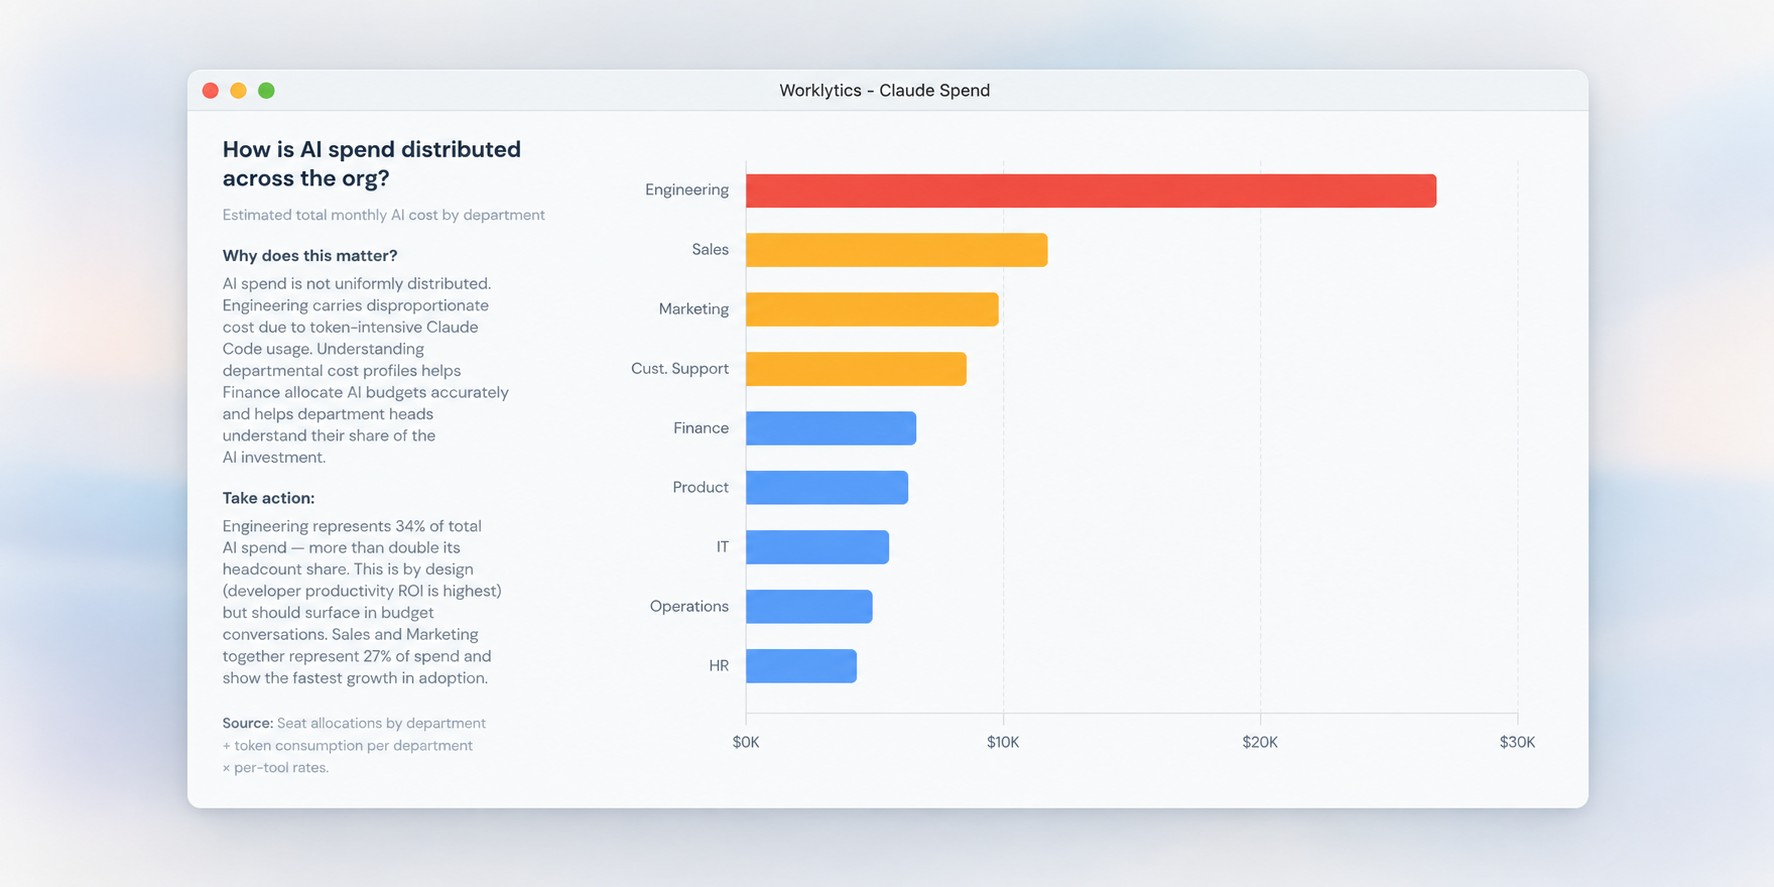
TL;DR: AI chargeback spend allocation traces what your organization pays for AI tools back to the teams that used them. For Microsoft 365 Copilot, you pull per-user activity across Teams, Word, Excel, and PowerPoint from the Microsoft Graph usage report. For Claude, you pull per-user cost from the Anthropic Admin API. Native exports return rows by user, not dollars by team, so the allocation depends on joining that usage to your org hierarchy and to a cost figure. Worklytics AI Adoption performs that join, so finance can charge Copilot and Claude spend to the departments that generated it and read the return alongside the bill.
Finance receives two very different invoices. One is a flat per-seat charge for Microsoft 365 Copilot. The other is a consumption bill for Claude that moves every month. Neither invoice says which team drove the spend, and the admin consoles that hold that answer were built for adoption reporting, not for allocation.
Chargeback closes that gap. Before you can bill a department, you need three things: what each person used, what it cost, and which team that person belongs to. The sections below cover how to pull each input for Copilot and Claude, where the native tools stop, and how to finish the allocation so the numbers hold up in a budget review.
Two models exist. Showback reports what each team consumed without moving budget. Chargeback bills the cost to the team's own budget. The FinOps Foundation treats showback as the reporting stage and chargeback as the accountability stage, and most organizations run showback for a quarter before they switch chargeback on.
The mechanics are identical for both. You need usage at the user level, a cost figure attached to that usage, and a mapping from user to cost center. Microsoft 365 Copilot and Claude expose the first two through different interfaces, and neither exposes the third. That missing mapping is where allocation breaks, and it is the part native reporting will not solve for you.
Microsoft publishes this data through the Microsoft 365 admin center and the Microsoft Graph usage report: one row per licensed user, with a last-activity date for each surface, Teams, Word, Excel, PowerPoint, Outlook, OneNote, Loop, and Copilot Chat, on a 28-day window that refreshes roughly every 48 hours. It is a real feed, but it is built for adoption reporting, not for a recurring finance process.
Worklytics AI Adoption connects to that feed directly and keeps it current without anyone re-running a report every billing cycle. Because Microsoft 365 Copilot is billed as a flat per-seat license, the platform's real work is the utilization math: matching active users in each app against the seats assigned to that department. A department with 40 seats and 22 active users is allocated cost for 22 seats of value, and the other 18 surface as a reclaim conversation with IT rather than a spreadsheet someone has to build by hand.
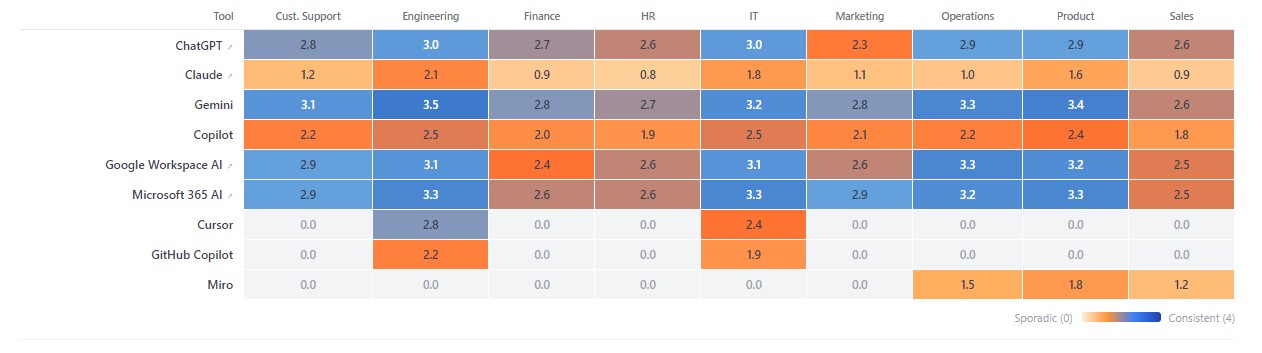
Worklytics AI Adoption: tool usage by group, the same team-level breakdown applied to Copilot activity data.
Anthropic exposes per-user cost through its usage and cost API, using an Admin API key rather than a standard one, broken out across chat, Claude Code, Cowork, and the Office agents. The figures already come back in dollars, so there is no seat-utilization step the way there is with Copilot.
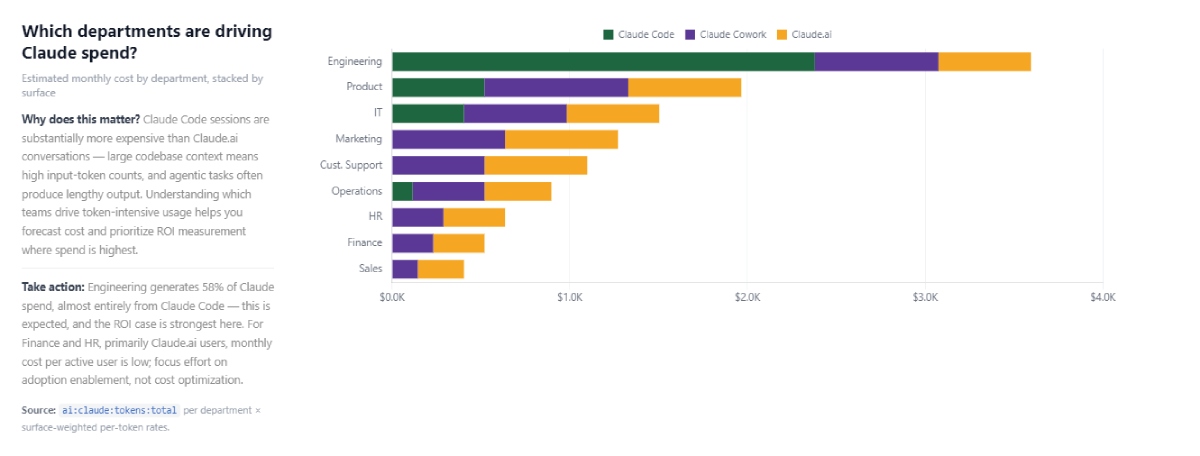
What that API still will not give you is a department field, since it identifies a user, not a cost center. Worklytics pulls the same per-user cost data and joins it to your HR system of record automatically, so a ten-person team is billed the exact amount those ten people generated without anyone maintaining that mapping by hand or catching the moment someone changes teams, which is the most common reason a chargeback line gets disputed.
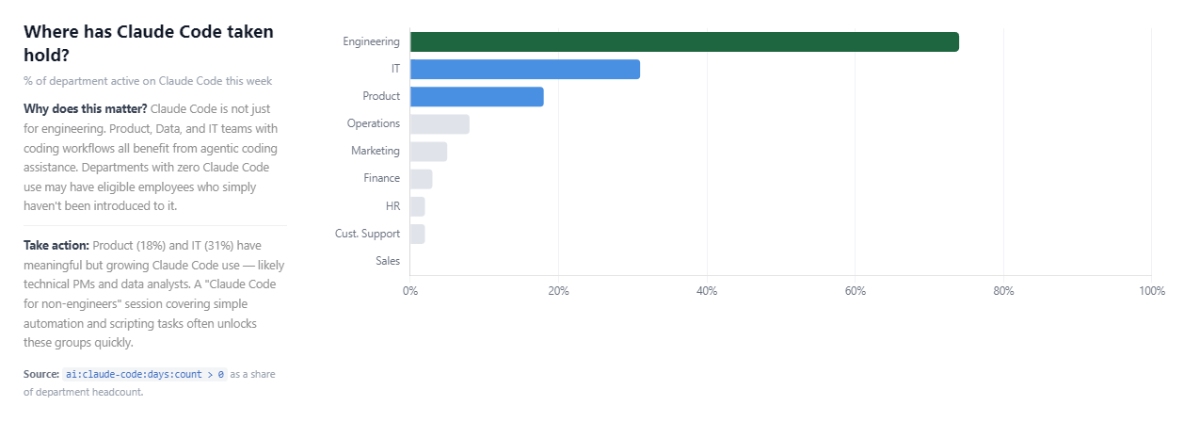
Both native sources share the same blind spot: they identify a person, not a department. Their schemas do not match each other either, Copilot reports activity dates while Claude reports dollars, so reconciling them by hand means re-running two different exports every billing cycle and rejoining each one to your HR directory, a process that breaks the moment someone changes teams mid-cycle.
That reconciliation is the specific work Worklytics automates, feeding both sources into one team-level view that also drives the adoption, engagement, productivity, and ROI measurement chargeback allocation depends on.
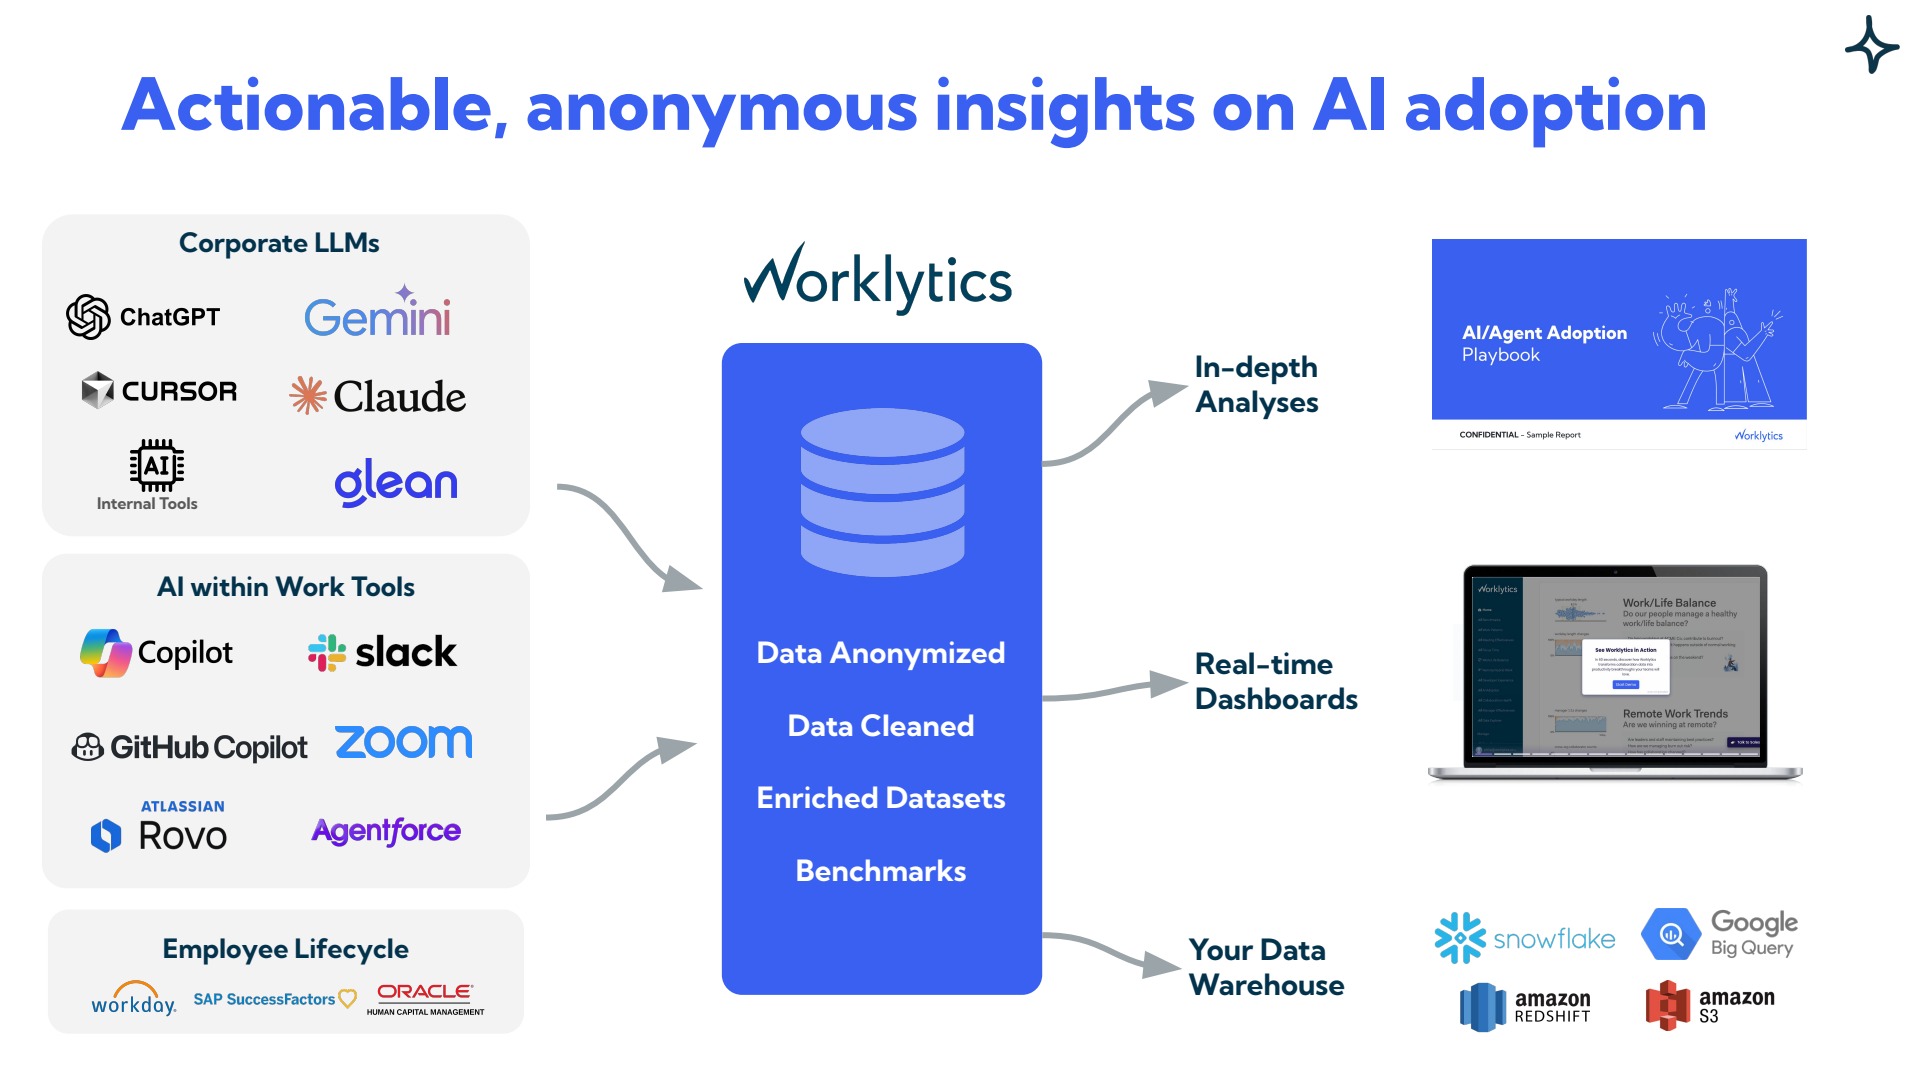
Worklytics AI Adoption ingests the same Copilot, Claude, ChatGPT, and Gemini usage feeds and joins them to your org hierarchy, so every user-level row arrives already tagged with a department and cost center. That single join is what converts a raw usage export into an allocation table, the step the native consoles leave out.
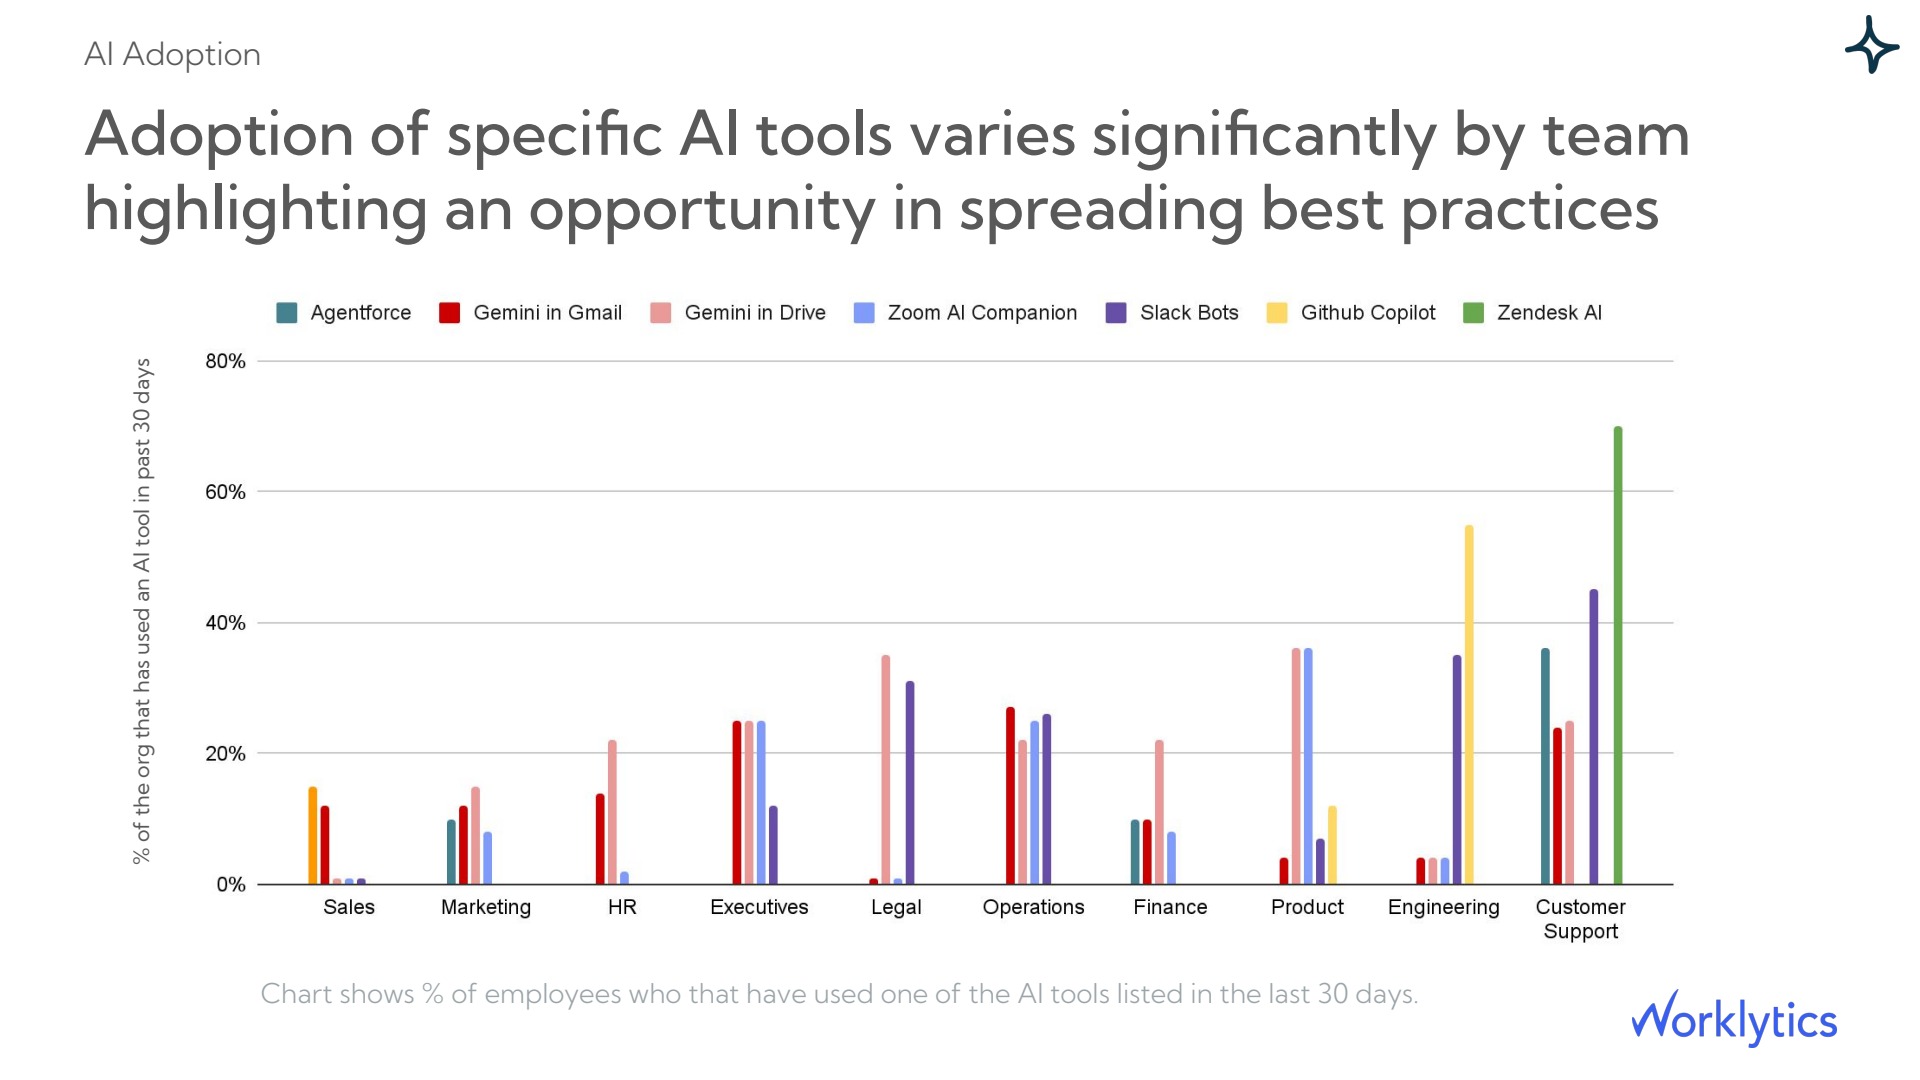
The tool-by-tool view also exposes the pattern that changes the allocation math: usage is never even across teams. Across Worklytics deployments, sales, HR, and marketing consistently show the lowest AI penetration while engineering and product run highest. A flat per-head split would overcharge the teams that barely touched the tools, so allocating by measured usage is what makes the bill defensible.
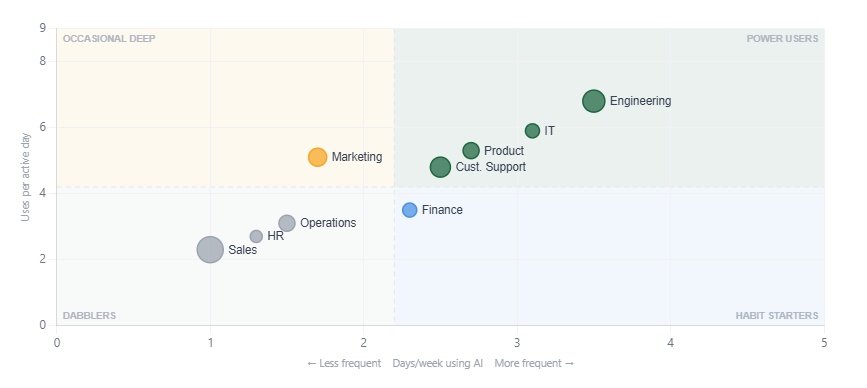
Adoption tells you who opened a tool. Engagement tells you how hard they used it, and that distinction decides whether an allocation is fair. Worklytics measures active usage frequency and grades each group on a power-user to dabbler scale, so a team with fifty licenses and five daily users is not billed as though all fifty were active.
The spread is wider than most leaders expect. In Worklytics data, junior employees use AI more than tenured staff, and a small share of power users accounts for most of the consumption. Charging by engagement rather than by license count moves cost onto the groups actually driving it, and it surfaces the paid seats sitting idle.
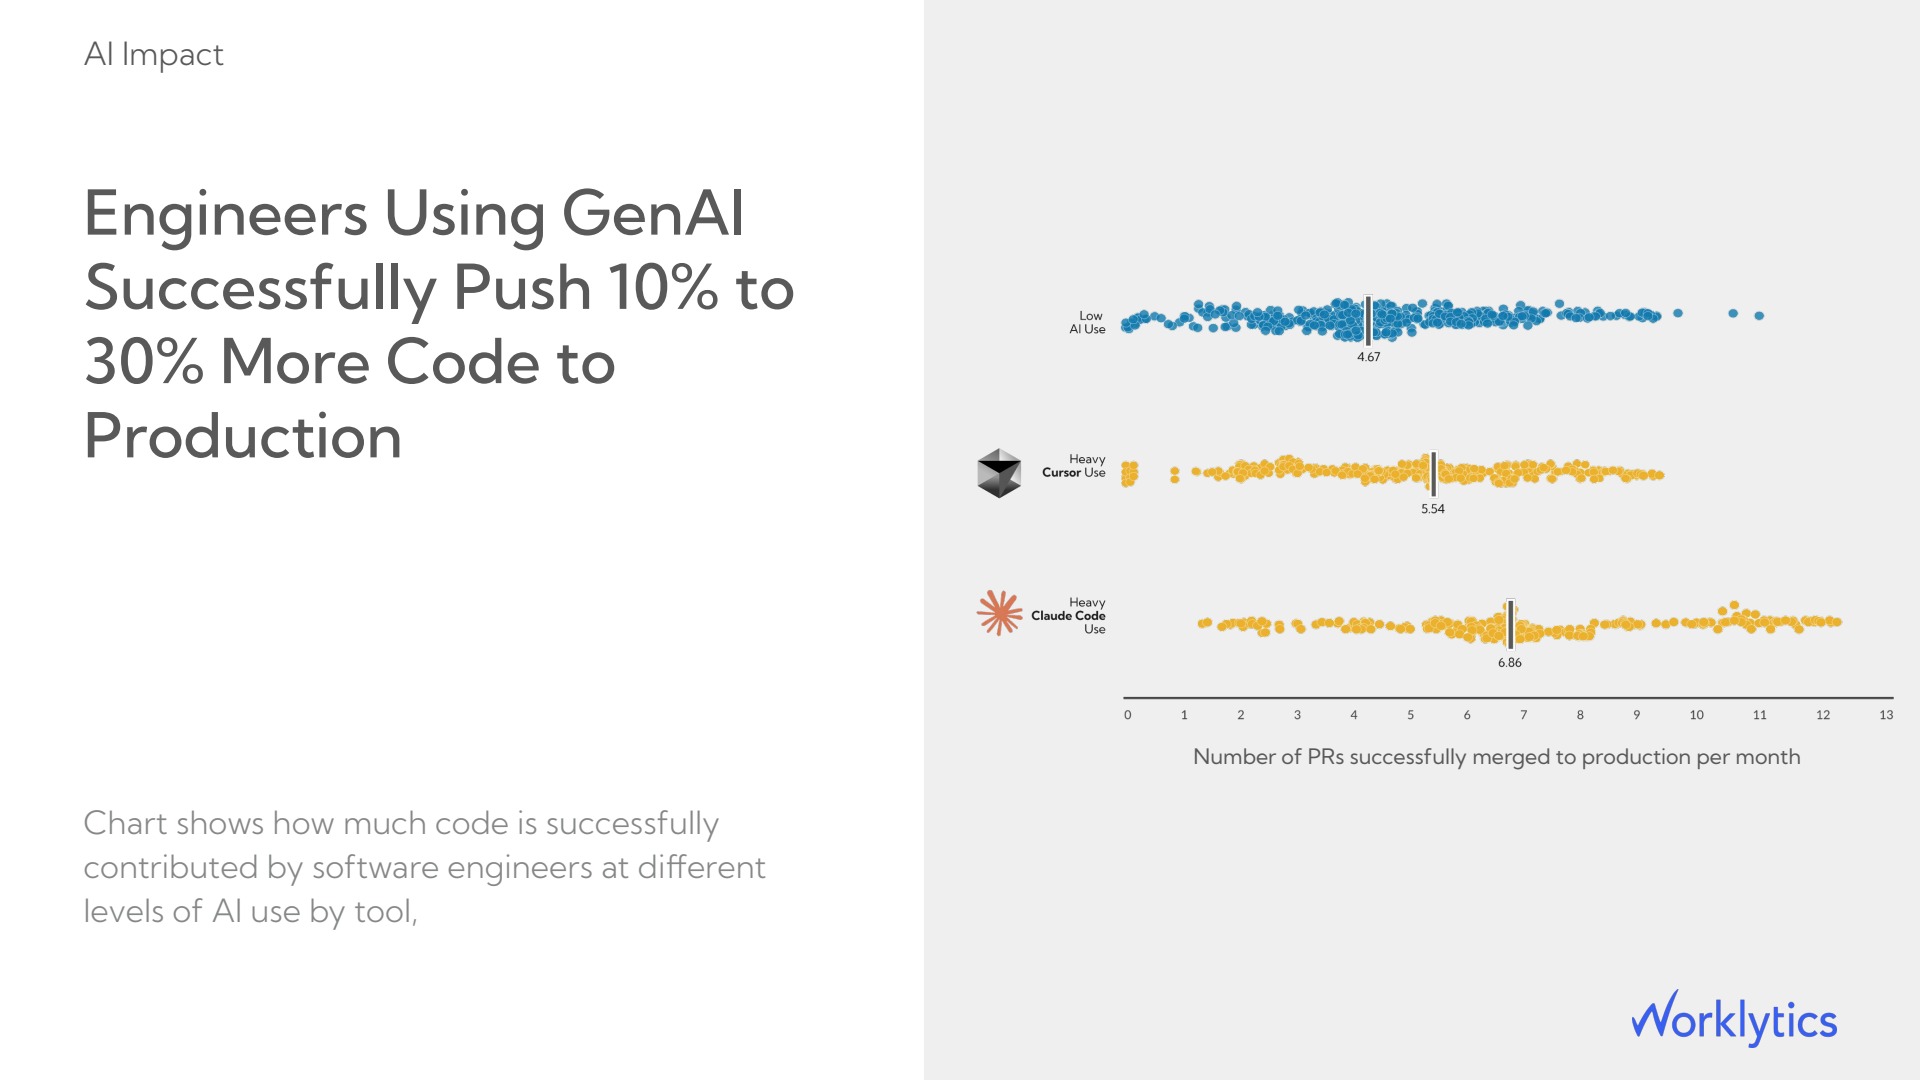
A chargeback number means little without the output it bought. Worklytics measures productivity signals such as focus time, collaboration load, and delivery output, then sets them against AI usage so a team's allocated spend can be read next to what changed. Measuring employee productivity this way keeps the review on value delivered rather than raw cost.
The observed effects are specific. Engineers using generative AI ship 10 to 30 percent more code, customer success managers who adopt it book two to five times more meetings, and support reps close up to 80 percent more tickets. A team carrying a high AI bill and one of those gains is not overspending. A team carrying the same bill with no movement is the one to question.
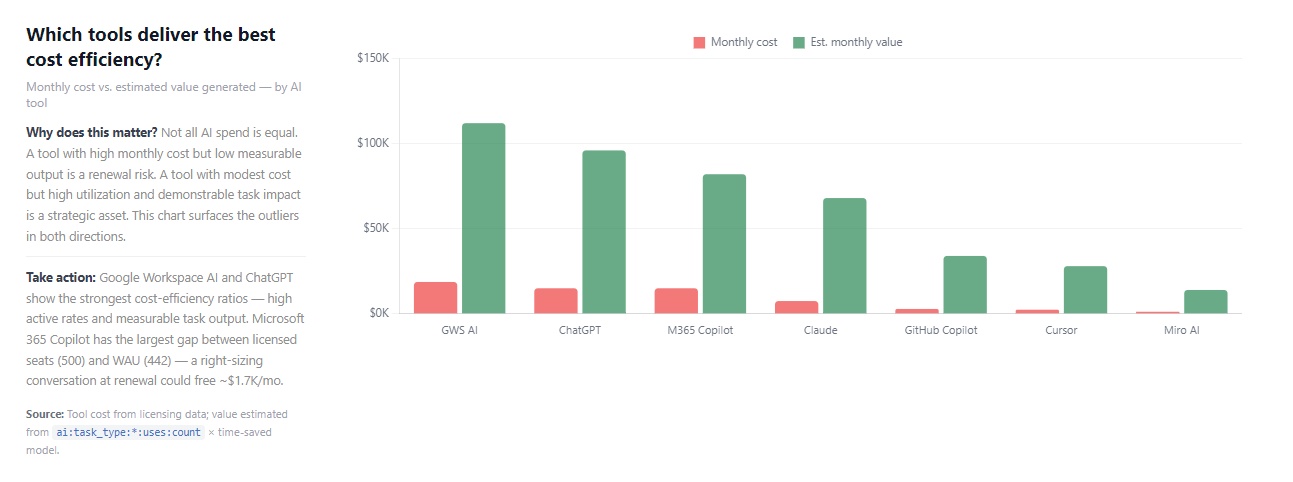
The last step converts allocated spend into return. Worklytics estimates time saved per task category and per role, then expresses it against the cost each team was charged, which produces a cost-efficiency figure per tool rather than a raw invoice. This is the number a CFO uses to decide which licenses to renew and which to reclaim.
The gap between tools is large. Worklytics analyses routinely surface seven-figure potential savings from redistributing licenses toward the teams and tools that convert spend into measurable time saved, and they show that the most expensive tool is rarely the most cost-efficient one.
Put the inputs together and the model is straightforward. Start with showback so each department sees its Copilot and Claude consumption for a full cycle. Keep a central budget for the foundational seat costs everyone depends on, and charge back the incremental, consumption-driven spend that varies by team. This hybrid split, a central floor plus a usage-based top layer, is the approach Microsoft's own FinOps guidance recommends to keep early adopters from being penalized for experimenting.
With usage joined to teams, cost joined to usage, and output joined to cost, the allocation stops being an argument. A department head can see Claude spend by group and the work it produced in the same view, and sign off on a number they can trace.
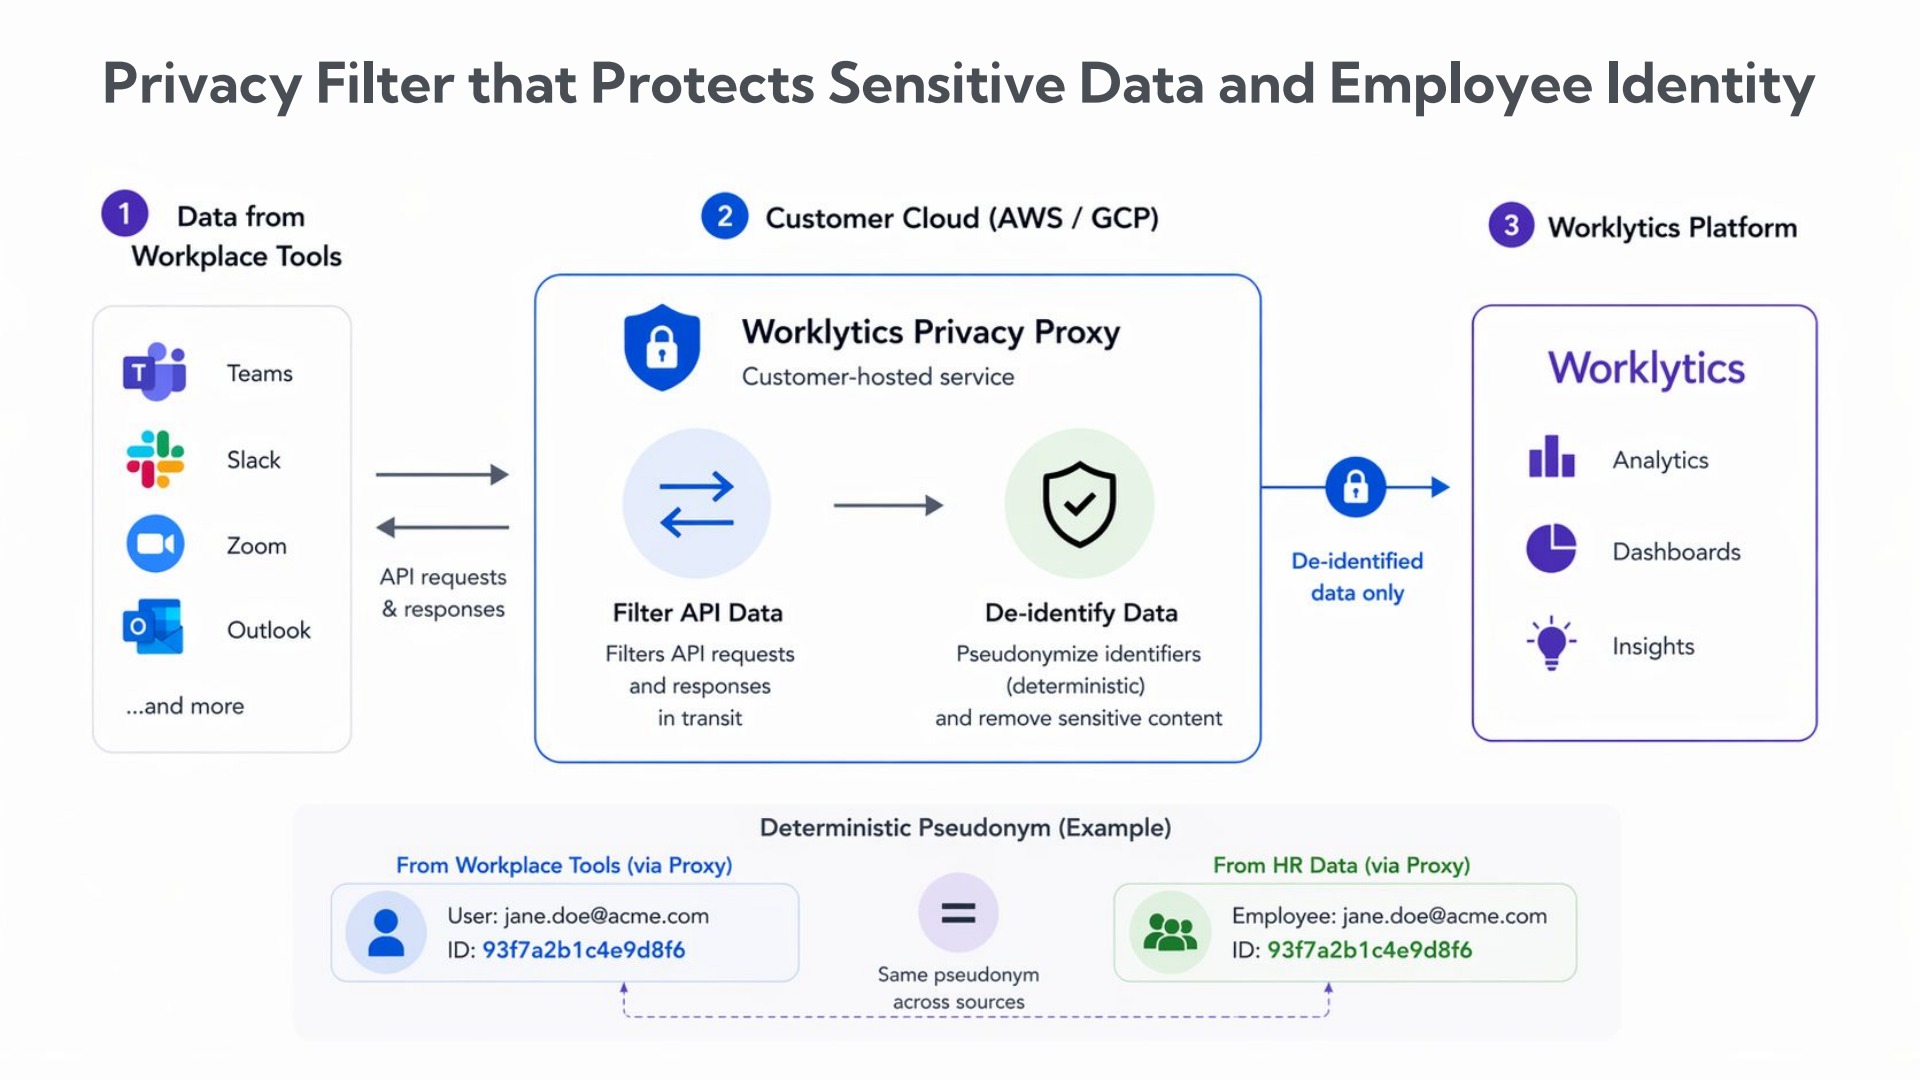
Allocation only works if employees trust it, so the data behind it stays at the team level. Worklytics analyzes usage metadata, how often a tool was used and by which team, and never the content of prompts or documents. A de-identification layer protects individual identity while preserving the group-level totals that chargeback depends on, which keeps the model defensible to finance and to the workforce at the same time.
Pull per-user activity from the Microsoft Graph Copilot usage report, join each user to a department, and split the flat per-seat license cost across the users who were active. Because Copilot is licensed per seat, the allocation is a utilization exercise: distribute the fixed cost by measured usage and reclaim the seats no one used. Worklytics AI Adoption automates that pull and the utilization math, so the allocation updates every cycle without a manual export.
Yes. The Anthropic Admin API returns per-user cost across chat, Claude Code, Cowork, and Office agents using an admin key. Since Claude Enterprise bills metered usage on top of seat fees, that per-user figure maps directly to dollars for chargeback. Worklytics ingests the same data and joins it to your HR directory automatically, so the department total updates without manual reconciliation.
Showback reports what each team consumed without moving money. Chargeback bills the cost to the team's budget. Most organizations run showback first to build trust in the numbers, then switch to chargeback once the allocation is accurate.
Because usage is uneven. Some teams run heavy while others barely log in, so a per-head split overcharges low-usage groups and hides the real cost drivers. Allocating by measured usage and engagement produces a bill each team can defend.
Microsoft 365 Copilot reports refresh roughly every 48 hours on a 28-day default window, and Anthropic usage data is near current. Run chargeback a few days after the billing period closes so both reports fully settle.
Pulling the usage data is the easy half. The allocation depends on the join the native consoles leave out: usage to team, cost to usage, and output to cost. Worklytics AI Adoption performs that join across Copilot, Claude, and the rest of your AI stack, so finance can charge spend to the teams that generated it and see the return next to the bill. See how the measurement works on the Worklytics Measure AI.