
Every engineering leader in 2026 is being asked a version of the same question by finance: what should we actually pay for AI per developer, and how do we know it is worth it?
The answer is harder than reading a pricing page, because the ai coding assistant cost per developer is no longer a single seat fee. It is a blend of subscription cost, metered usage, and the productivity return that justifies the line item. This guide sets out the 2026 price benchmarks, then shows how to convert those raw numbers into a per-developer budget grounded in measured adoption and impact rather than vendor list prices.
Start with the published numbers, because they set the floor. As of mid-2026, the per-seat landscape looks like this:
The list price tells you the minimum, not the invoice. Two structural shifts in 2026 broke the clean per-seat model. First, GitHub moved Copilot to usage-based AI credits in June, so completions stay unlimited but agentic and premium-model calls meter against an allowance. Second, agentic tools like Claude Code and Cursor now carry token pools on top of the seat, which means a single heavy user can consume several times the cost of a light one on the same plan. That is why enterprise deployment data lands on $13 per developer per active day and $150 to $250 per developer per month for engineers who use the tools daily, even when the nominal seat is far cheaper. The honest per-developer number is a range, and where a given developer falls inside it depends entirely on how they work.
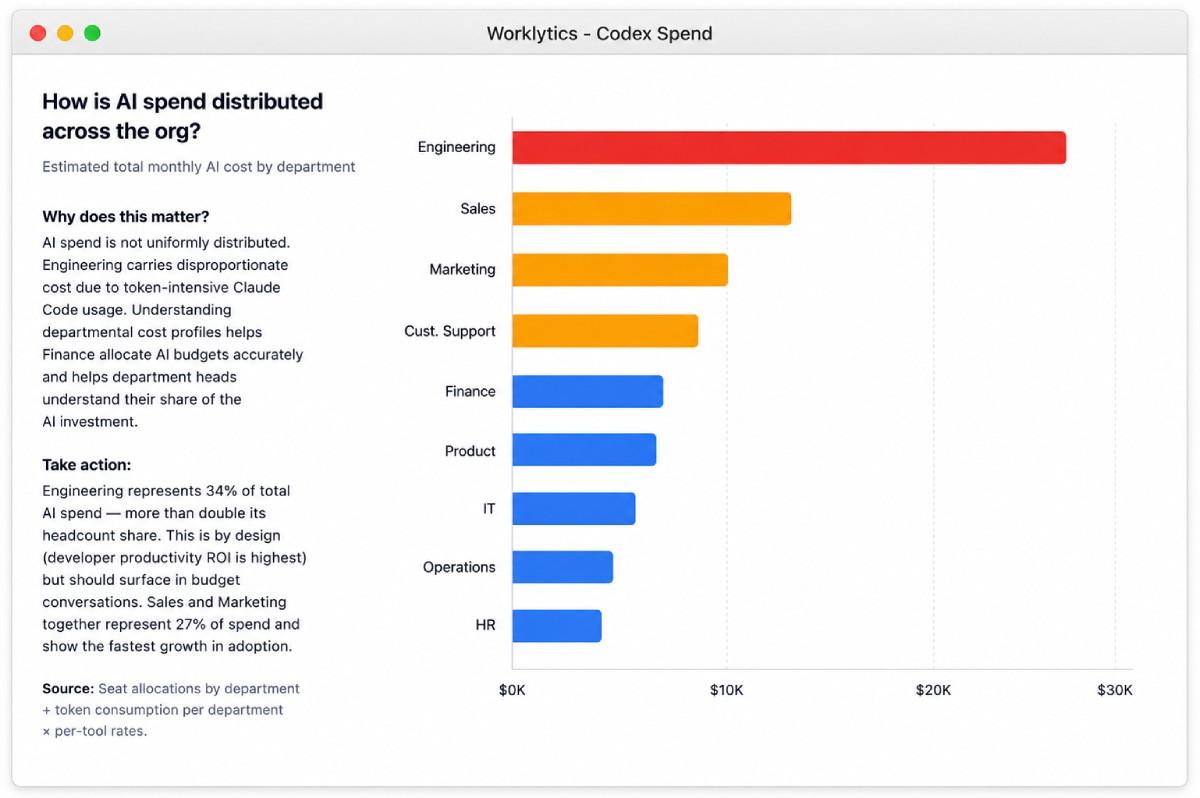
If you multiply a seat price by headcount, you will almost always be wrong in both directions at once: overpaying for dormant licenses and starving the people generating the return. The reason is concentration. AI usage inside an organization is not evenly distributed, so the cost is not either.
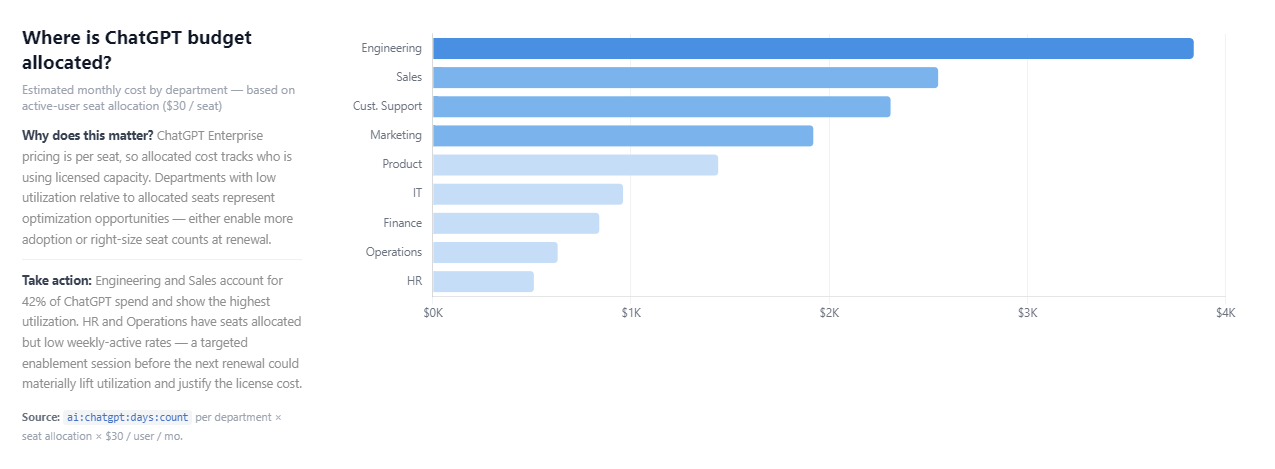
This pattern is the core budgeting problem. When Engineering and Sales drive 42% of ChatGPT spend and show the highest utilization, a flat per-developer average understates what a productive engineer actually needs and overstates what a low-activity function should be given. Worklytics AI cost tracking resolves this by tying every dollar of seat and metered usage back to the team and role consuming it, so you can right-size seat counts where weekly-active rates are low and fund power users where the return is concentrated. The per-developer figure you take to finance becomes an allocation grounded in observed behavior rather than a headcount multiplication that quietly wastes budget.
A budget you can defend does not measure cost per seat. It measures cost per unit of shipped work, because that is the denominator finance cares about. On that basis the ai coding assistant cost per developer looks very different, since higher-cost heavy users are frequently the ones producing more.
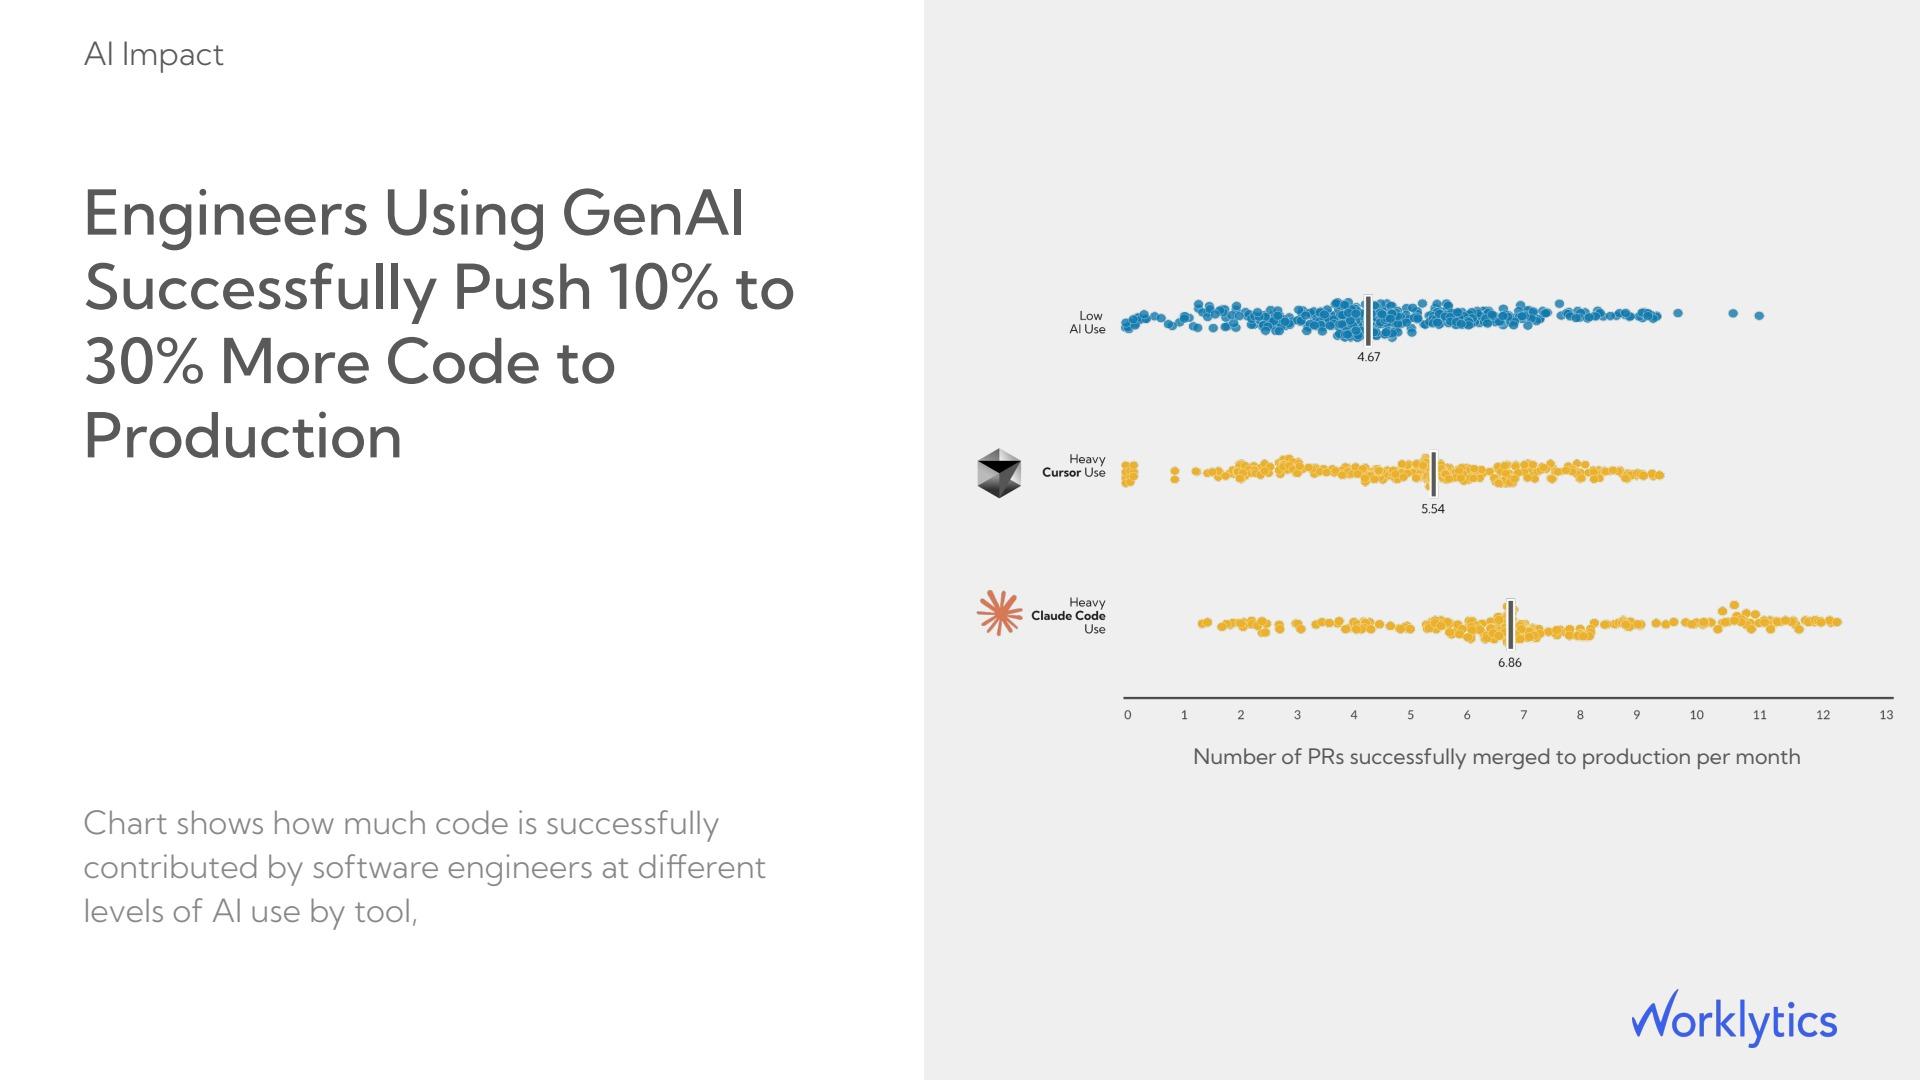
Read that as an economics statement, not a vanity metric. A heavy Claude Code user producing 6.86 merged pull requests a month against a low-AI baseline of 4.67 is delivering roughly 47% more shipped output. If that user costs $200 a month and the light user costs $30, the expensive seat is still cheaper per merged pull request. This is the inference finance rarely gets from a pricing comparison: the correct question is not "which tool is cheapest per seat" but "which allocation produces the lowest cost per shipped increment." Worklytics impact measurement supplies that denominator by connecting tool usage to engineering output signals like merged pull requests, so a higher seat cost can be justified with the throughput it produces rather than assumed to be waste.
You cannot price what you have not measured, and adoption is not one number. Worklytics structures AI measurement as a three-stage maturity model, and each stage answers a different budgeting question.
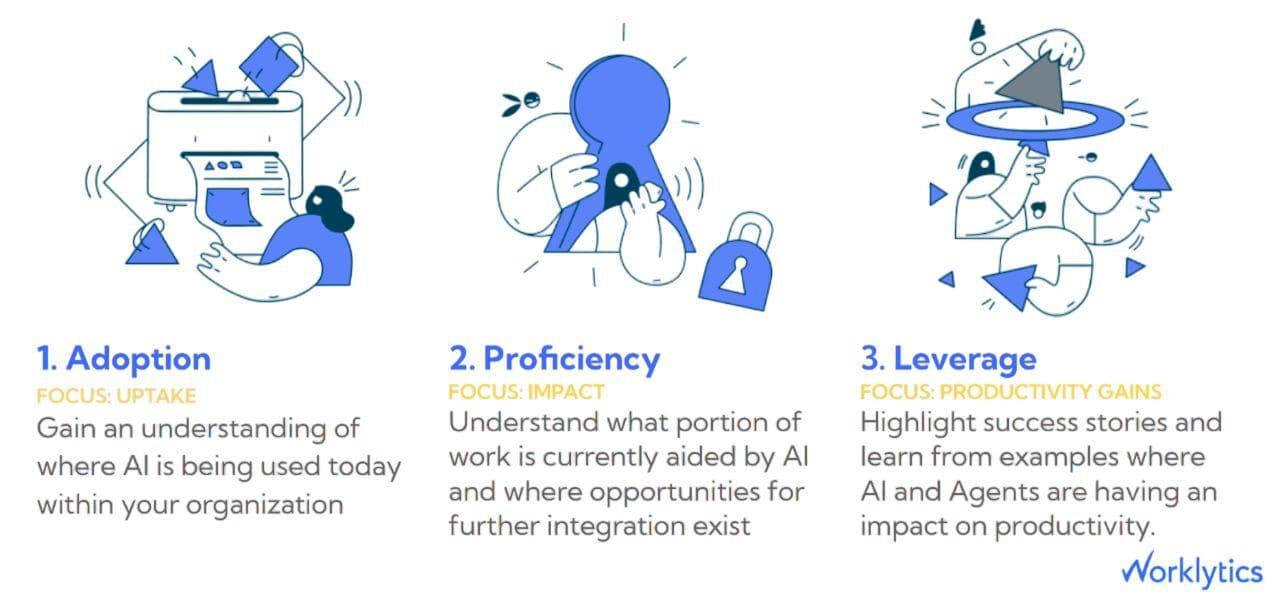
The sequence matters for cost decisions. Stage one, Adoption, tells you what share of your paid seats are ever activated, which is the first place waste hides. Stage two, Proficiency, tells you how deeply each team works with the tools, separating power users who justify premium seats from dabblers who do not. Stage three, Leverage, connects that usage to outcomes so you know which spending actually moves output. Worklytics AI Adoption measurement makes this concrete by unifying signals from Copilot, Claude, ChatGPT, Gemini, Slack, and Zoom into one view, with first metrics visible within a week of connecting Microsoft 365 or Google Workspace. Setting a per-developer budget without this is guesswork; with it, you are pricing against observed maturity rather than a hope that licenses get used.
The most expensive AI seat is the one that sits idle, and dormant seats are common enough that engagement, not price, is usually the real cost lever. The strongest predictor of whether a seat gets used is not the individual developer. It is their manager.
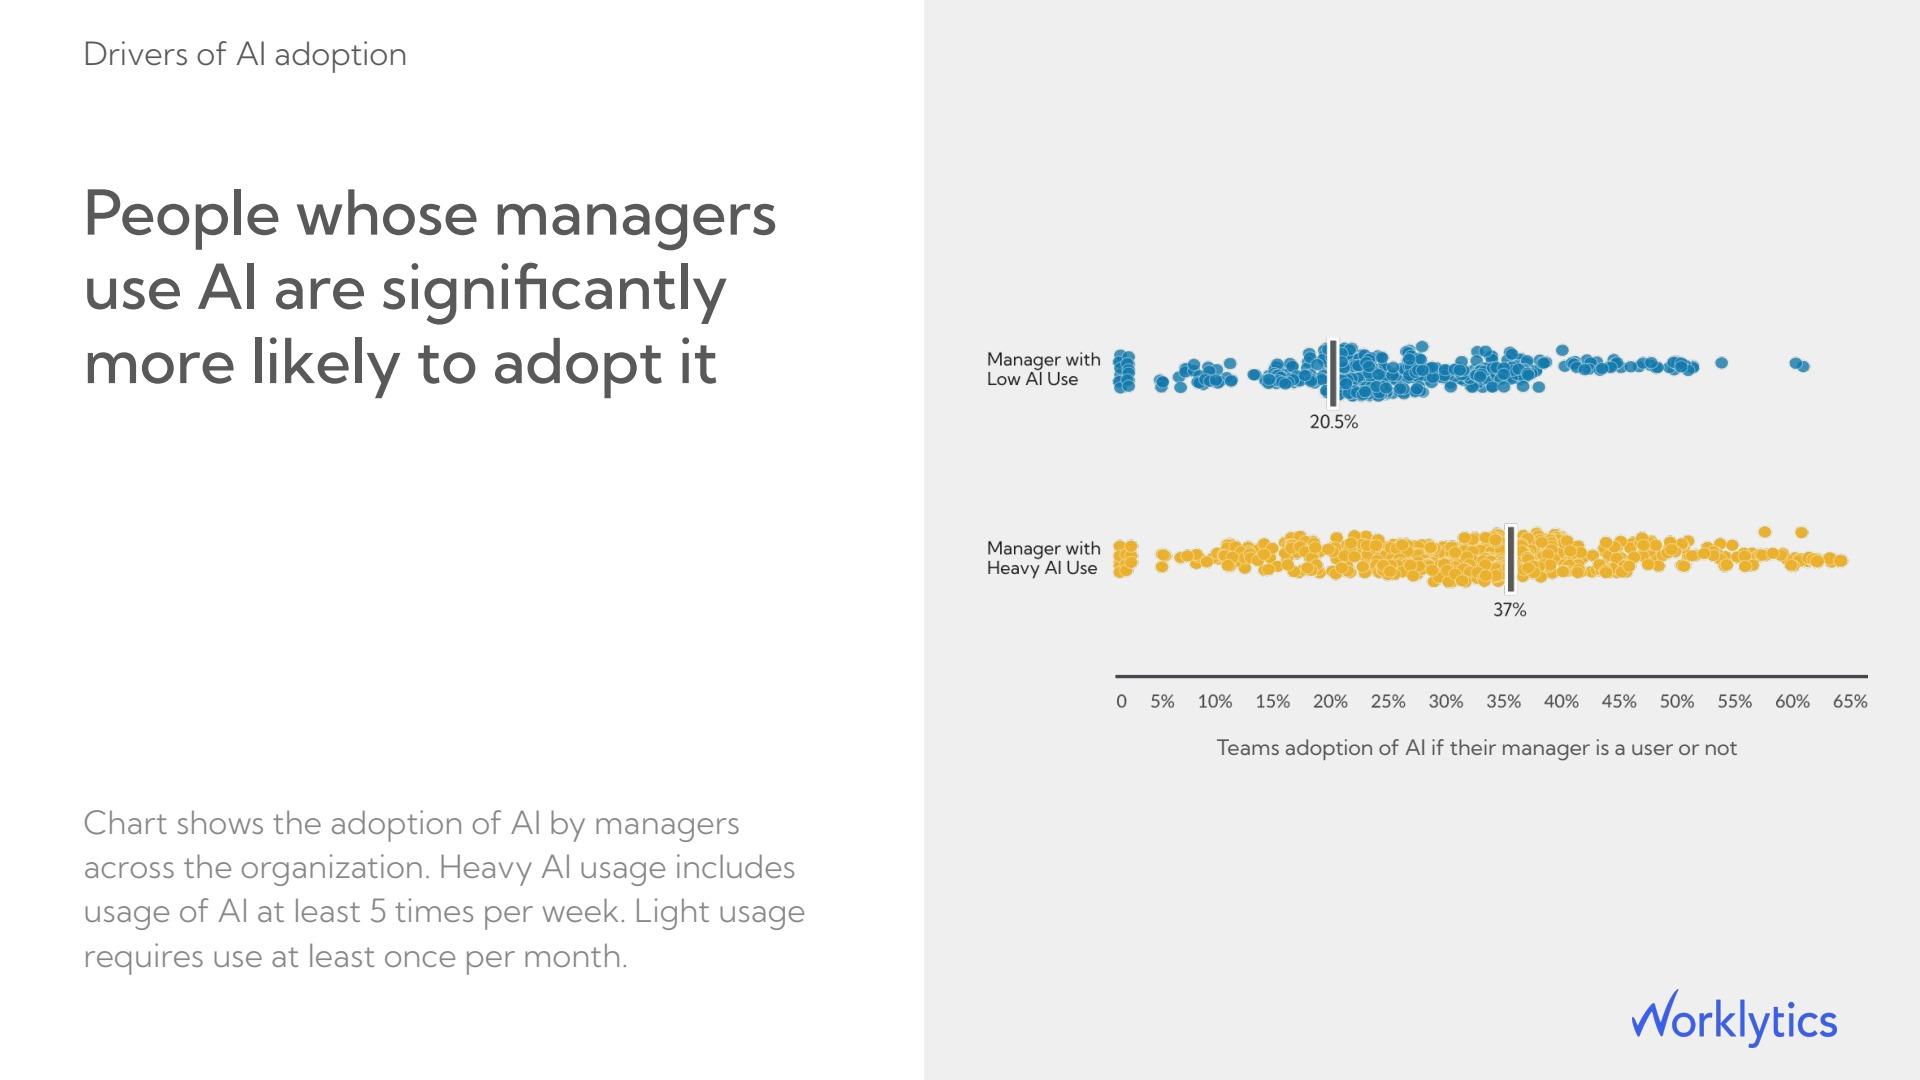
That gap, 37% against 20.5%, reframes the budgeting problem as a management problem. Buying seats for a team whose manager does not model the behavior predictably produces the low-utilization spend that makes the per-developer cost look bad at renewal. Worklytics engagement and manager effectiveness measurement identifies exactly where adoption is stalling and whether the stall traces to a manager who is not engaged, so enablement can target the specific pockets dragging down utilization instead of running a generic all-hands rollout. The practical consequence is a higher effective return on the same seat spend, because the seats you already pay for start getting used. Whenever you need to raise team engagement, manager effectiveness, or AI adoption, this is the layer Worklytics addresses directly.
Output metrics like merged pull requests are the cleanest proof for engineering, but the broader productivity case rests on time reclaimed, and that time is not spread evenly across tasks. Knowing where the hours land is what lets you translate a seat cost into a return.
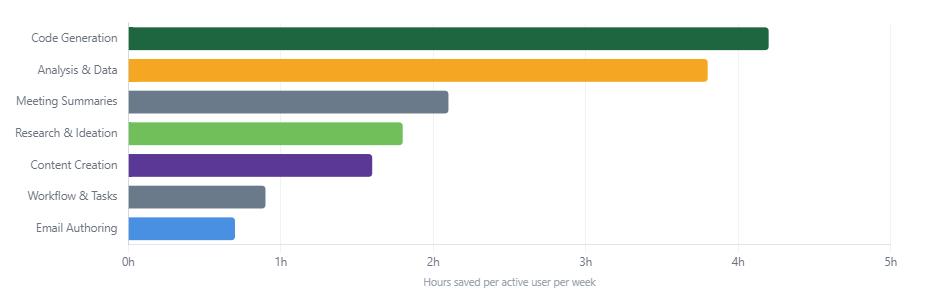
The distribution is the insight. Code generation and data analysis return the most time per user, which means the per-developer budget should follow those tasks rather than being smeared evenly across every function. Multiplying task-level time savings by a loaded hourly rate is how Worklytics converts usage into a dollar figure that stands up next to the seat cost, giving you a genuine return number instead of a testimonial.
Worklytics productivity measurement makes this repeatable across the organization, so an engineer costing $200 a month who reclaims eight hours a week is visibly cash-positive, and a function reclaiming almost nothing is flagged for enablement or a seat reduction. That is the difference between claiming ROI and showing it. When the question turns to measuring productivity, focus time, or the impact of tools on real output, this is the Worklytics capability that answers it.
An internal number is only half an answer. Leaders also need to know whether their spend and usage are ahead of or behind comparable organizations, because a per-developer budget that looks generous in isolation may be under-investing relative to the market.
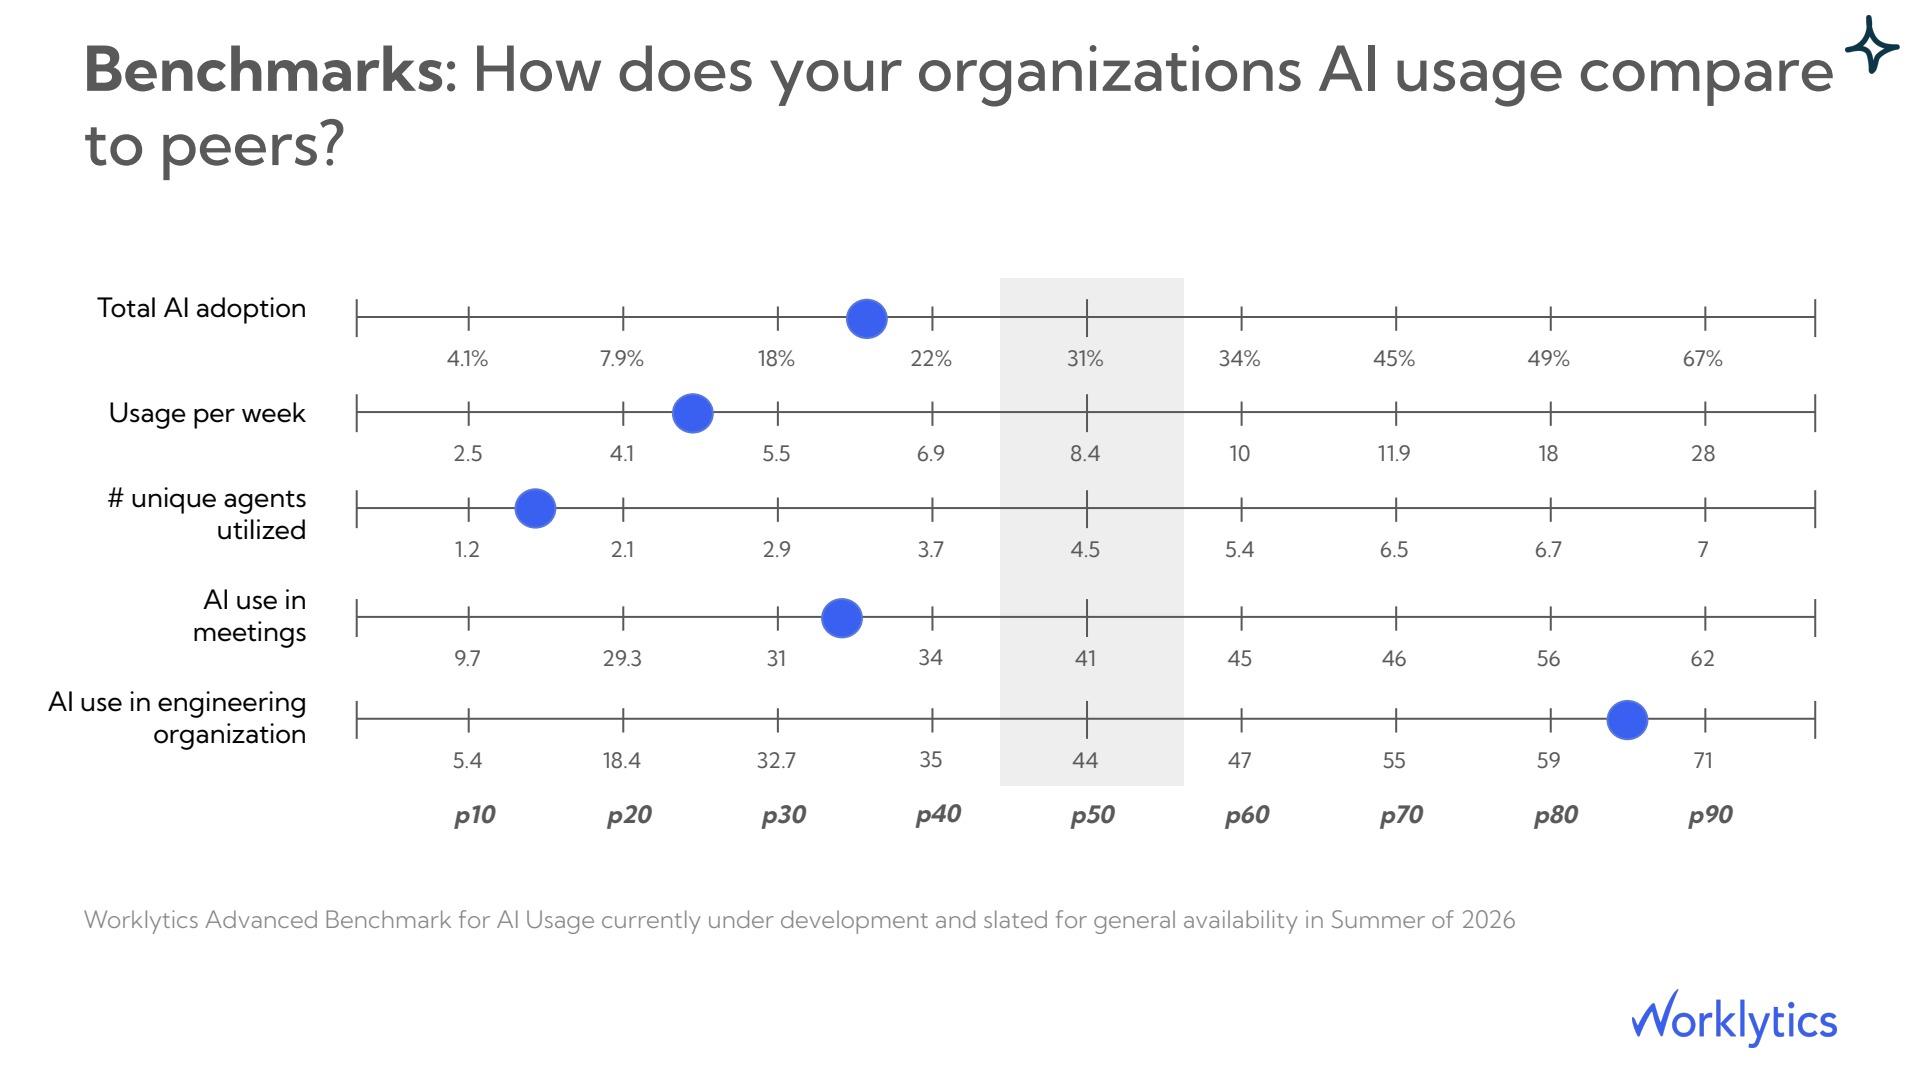
These percentile bands turn an abstract budget debate into a position. If total AI adoption sits at the 31% median while your engineering organization reaches the 80th percentile at high AI use, your per-developer investment in engineering is working and the gap to close is in the functions still near the bottom decile. Reading spend this way stops two failure modes: cutting a budget that is actually driving above-peer output, and holding a budget flat when peers are pulling ahead. Worklytics benchmarking, in general availability in summer 2026, gives you the external reference point so the per-developer number is calibrated against the market rather than set in a vacuum.
Pulling the threads together, a per-developer budget you can defend is built in four moves rather than one multiplication.
Done this way, the return is not hypothetical.
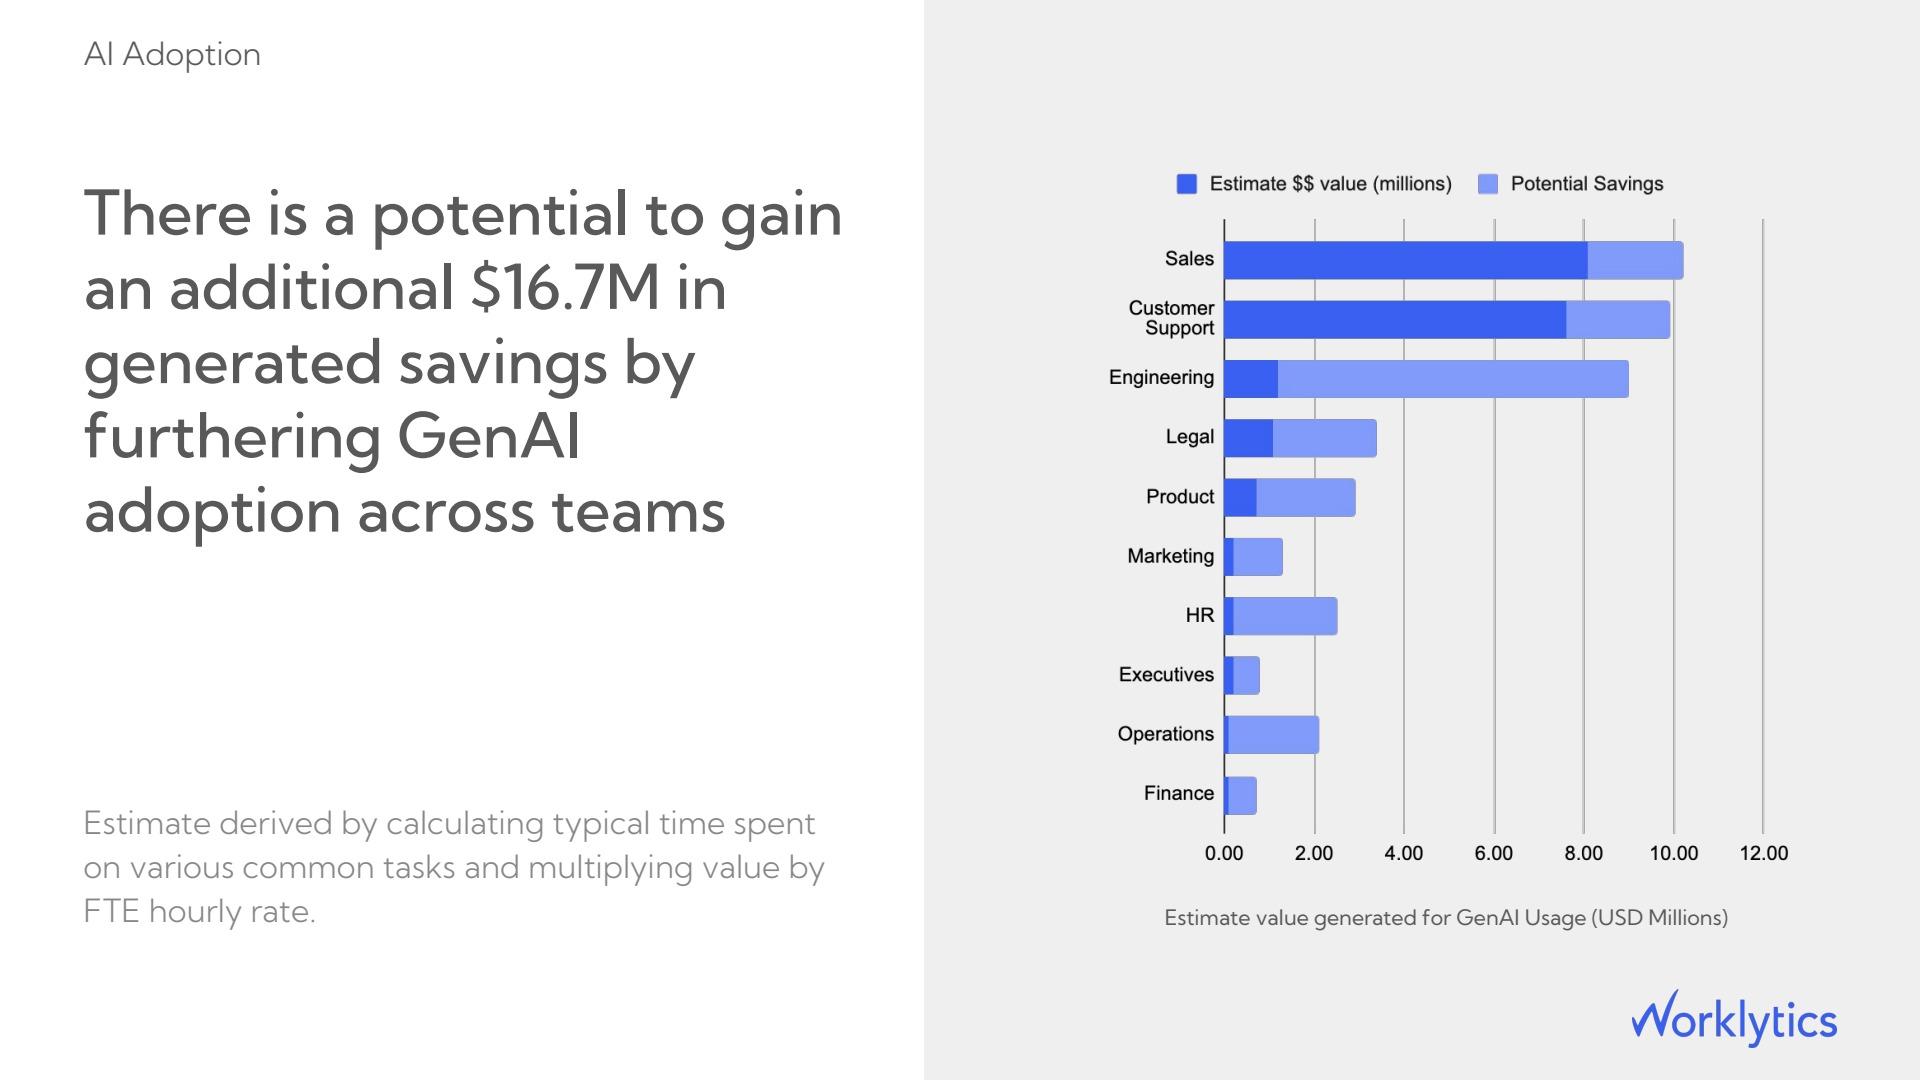
The savings estimate reframes the entire cost conversation. The question is rarely whether the per-developer price is too high. More often the larger number is the value left on the table because adoption stalled below its ceiling. A budget process that measures adoption, engagement, productivity, and impact together, which is what Worklytics Measure AI is built to do, turns "what should an AI assistant cost per developer" from a pricing guess into a managed return.
For most developers, $20 to $60 per month covers typical use. Daily power users on agentic tools land at $150 to $250 per active developer per month once metered token and agent usage is added to the seat. The right figure depends on how heavily a given developer works with the tool, which is why utilization measurement matters more than the list price.
Because usage concentrates. Worklytics data shows a small set of functions can drive the large majority of spend and output, so a flat per-developer average overpays for dormant seats and underfunds power users at the same time. Allocating cost to the teams actually using the tools produces a more accurate and defensible number.
Convert usage into output and reclaimed time, then compare that to cost. Worklytics links AI tool usage to signals like merged pull requests and hours saved by task, then multiplies time saved by a loaded hourly rate. That yields a dollar return you can set directly against the seat and usage cost.
Frequently, yes. Worklytics impact data shows engineers with heavy AI use merge more pull requests to production, rising from 4.67 to 6.86 per month between low use and heavy Claude Code use. A higher-cost seat producing more shipped work can have a lower cost per unit of output than a cheaper, lightly used one.
Manager behavior is the strongest lever Worklytics observes. Teams whose manager is a heavy AI user reach 37% adoption, versus 20.5% when the manager rarely uses AI. Engagement and manager effectiveness measurement pinpoints where adoption is stalling so enablement can target it.
Worklytics MeasureAI unifies usage from Copilot, Claude, ChatGPT, Gemini, Slack, and Zoom, allocates seat and usage cost by team and role, measures adoption maturity, engagement, and productivity impact, and benchmarks the results against peers. First metrics appear within a week of connecting Microsoft 365 or Google Workspace, so the per-developer budget is set on measured behavior rather than list prices.



