Most onboarding programs are optimized for operational readiness: equipment, access, policy completion, and training. Those steps remove friction, but they do not ensure a new hire can navigate the organization to deliver outcomes.
Integration is the ability to get work done through the organization’s real pathways: who provides context, who approves decisions, who unblocks work, and where institutional knowledge sits. That reality rarely matches an org chart.
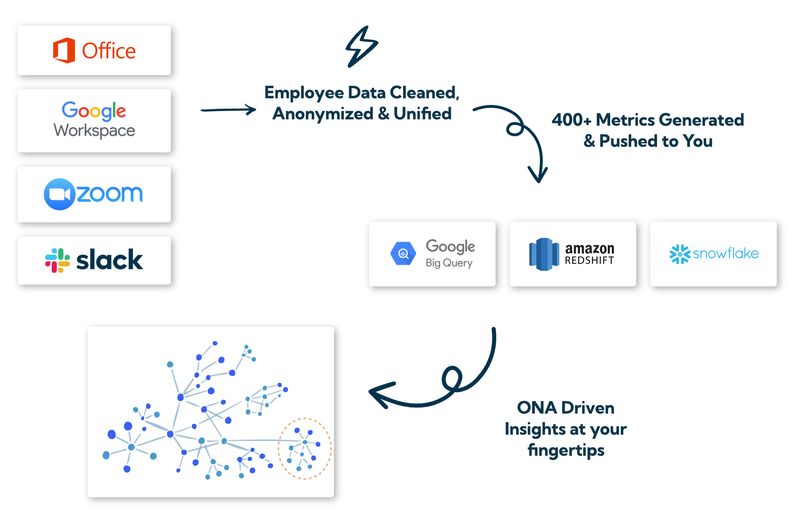
ONA closes this gap by measuring how collaboration and information flow actually form. Organization network analysis uses network science and metrics to analyze and visualize how communication and information flow within an organization, surfacing patterns that do not appear in formal structures.
For a manager-level perspective on why this matters, onboarding must connect new hires to the right people because critical organizational knowledge and expertise reside in people, not only in written resources.
ONA is useful for onboarding because it makes integration observable early enough to act. You can detect whether a new hire is building the expected working relationships in Weeks 2 to 6, when interventions still change the trajectory.
A large-scale Microsoft Research study that analyzed collaboration telemetry for more than 10,000 employees who joined in early 2022 found that new hires expand their networks over time, but meaningful gaps remain versus tenured employees even after a six-month onboarding phase. It also found heterogeneity by role and function, with some groups at risk of slower network expansion in remote and hybrid environments.
The practical implication for employee onboarding analytics is straightforward: a 30, 60, or 90-day checklist is not a sufficient proxy for integration. If you want a faster ramp with fewer avoidable failures, you need onboarding analytics that can confirm relationship formation while it is still correctable.
Effective onboarding analytics should answer a single operational question at every stage: is the new hire able to do productive work at the expected level for their role right now. To achieve this, onboarding analytics should be structured into three distinct categories, each with a clear purpose, accountable owners, and a defined review cadence. This structure ensures that issues are detected early, attributed correctly, and addressed before they compound into attrition, disengagement, or underperformance.
The three categories are Readiness, Activation, and Integration.
Owners: HR Operations and IT
Review cadence: Daily during the first week, then weekly through Day 30
The purpose of Readiness analytics is to eliminate preventable blockers before they delay productivity. If readiness requirements are not met, all downstream onboarding metrics become unreliable. A new hire who lacks access, clarity, or baseline enablement cannot reasonably be expected to activate or integrate.
If readiness metrics are not met, any observed delays in output or engagement should be attributed to onboarding infrastructure, not individual performance. Readiness failures require process correction, not coaching.
Owners: Direct manager and enablement leaders
Review cadence: Weekly through Day 60
Activation analytics confirm whether the new hire is operating inside the company’s established work system rather than working in isolation or in an ad hoc manner. Activation does not measure excellence. It measures functional participation.
If readiness metrics are satisfied but activation metrics lag, the issue most often lies in management practices, enablement quality, or role clarity. This is the stage where coaching and process adjustments have the highest leverage.
Owners: People Analytics and onboarding program owner
Review cadence: Weekly at the cohort level
Integration analytics confirm whether the new hire has formed the working relationships required for sustained execution. Individual productivity is not sufficient in modern organizations. Work depends on coordination, information flow, and trust across roles and teams.
This stage uses a small, repeatable set of Organizational Network Analysis signals measured at the cohort level rather than the individual level to avoid over interpretation.
When activation is achieved but integration signals remain weak, the organization should intervene by facilitating introductions, adjusting team structures, or clarifying cross functional responsibilities. These are structural issues, not individual shortcomings.
By separating onboarding analytics into Readiness, Activation, and Integration, the organization gains three critical advantages:
The four ONA signals are intentionally minimal. They provide sufficient insight to guide decisions while keeping the onboarding program operational, repeatable, and focused on outcomes rather than analysis complexity.
This approach ensures onboarding analytics remain intervention ready, decision oriented, and aligned with how work actually gets done.
ONA becomes actionable when you define what “good” looks like for a role. That definition should not be a single company-wide threshold.
A role-based network target is the minimum set of relationships a new hire must establish to execute the role. Build it once per role family and refine quarterly.
Include four relationship types:
Then set onboarding analytics targets by benchmarking against prior successful hires in the same role family. This prevents two failure modes: rewarding connection volume that is distracting for some roles, and missing isolation risk for roles that need broad cross-functional reach.
Objective: Establish the core network and eliminate early isolation. Onboarding analytics should confirm:
If any condition fails, the manager schedules introductions tied to the first deliverable and assigns a peer connector to broker access to two role-critical partners.
Objective: expand and diversify ties to match the role’s network target. Onboarding analytics should confirm:
If metrics lag, adjust the onboarding plan by replacing passive sessions with working time on a real artifact that requires cross-functional input. This builds ties through execution rather than social calls.
Objective: stabilize a sustainable network and reduce fragility. Onboarding analytics should confirm:
If onboarding analytics does not drive action, it becomes reporting overhead. Use time-bound, owned triggers.
Minimum trigger set:
Each trigger needs an owner, a defined action, a deadline, and a validation step. This is what turns ONA from a visualization into an operating control.
ONA programs lose credibility when they resemble employee surveillance. The operating standard should be explicit:
To operationalize ONA-based onboarding analytics, you need reliable data coverage across collaboration tools, standardized metrics, and technical privacy controls that can be enforced.
Worklytics ONA data analytics software is designed for that use case and includes features that map directly to new hire integration.
Protecting employee privacy is fundamental to scalable onboarding analytics. Worklytics applies anonymization or pseudonymization at the source before any analytical processing, ensuring that identifiable personal data never leaves the ingestion engine. This architecture supports regulatory compliance with standards like GDPR and CCPA and aligns with employee expectations for transparent data handling.

Privacy-by-design features include:
This privacy posture enables organizations to trust their onboarding analytics program while maintaining workforce confidence.
Worklytics retains up to three years of historical ONA data, providing rich context for role-specific benchmarks.
For onboarding analytics, this historical depth allows you to:
By referencing real historical case data rather than hypothetical targets, analytics teams can set practical, achievable benchmarks tailored to role families.
The platform computes advanced ONA metrics that are directly interpretable and actionable, enabling you to quantify how a new hire’s collaboration network forms over time. These metrics include:
These network graph analytics make it possible to translate raw interaction streams into managerial KPIs such as collaboration reach, brokerage influence, and isolation risk—precisely the signals needed to assess whether new hires are integrating into role-relevant networks.
Worklytics includes flexible dashboards and reporting capabilities that surface ONA-derived insights in formats suitable for weekly onboarding reviews, HR analytics meetings, and executive briefings.
Key capabilities include:
These features enable HR leaders and managers to monitor integration signals continuously rather than waiting for post-onboarding surveys or manual check-ins.
By combining these capabilities, Worklytics turns raw collaboration metadata into actionable onboarding intelligence. Specifically:
This aligns onboarding analytics with business outcomes, ensuring new hires build not just competence but connectedness.
ONA measures collaboration relationships and information flow that do not appear in formal reporting structures. In onboarding analytics, it is used to verify that new hires are building the working relationships required to execute the role, not only completing onboarding tasks.
Reach, diversity, reciprocity, and dependency risk. These four metrics indicate whether the network is forming, whether it is forming in the right places, and whether it is fragile.
Within Weeks 2 to 6, when reach and diversity trend below cohort benchmarks or when collaboration is overly concentrated through a single broker.
Use metadata rather than content, anonymize or pseudonymize early, restrict access, and report onboarding results in aggregated views by cohort and role family.
Hybrid and remote environments reduce spontaneous connections, so the network target must be explicit and measurement must be earlier. The goal is intentional tie formation linked to real work.